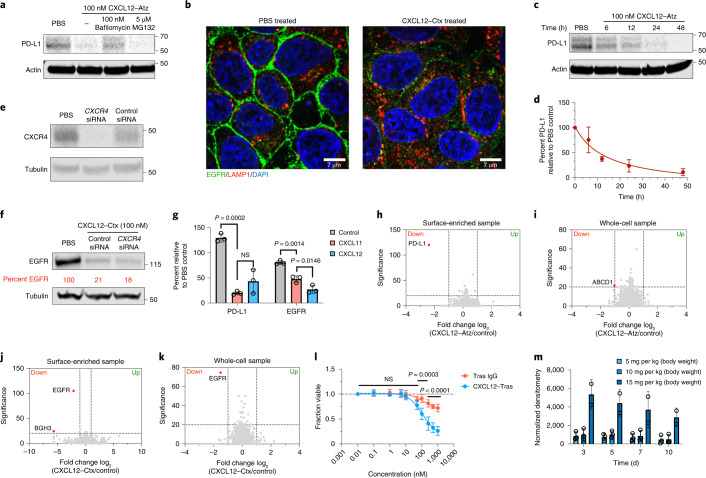
Fig. 3. KineTACs mediate target degradation in a highly selective, lysosomal-, time- and CXCR7-dependent manner.
a, Pretreatment for 1 h with either 100 nM bafilomycin or 5 µM MG132 in MDA-MB-231 cells followed by 24 h of treatment with 100 nM CXCL12–Atz indicates that CXCL12–Atz degrades PD-L1 in a lysosome-dependent manner. b, Confocal microscopy images of HeLa cells treated for 24 h with 100 nM CXCL12–Ctx show near complete removal of EGFR. c,d, Time-course experiment shows increased PD-L1 degradation over time after treatment with 100 nM CXCL12–Atz. e, siRNA knockdown of CXCR4 in HeLa cells after a 48-h transfection. f, EGFR levels are unchanged after siRNA knockdown of CXCR4 followed by 24 h of treatment with 100 nM CXCL12–Ctx in HeLa cells. g, PD-L1 in MDA-MB-231 cells or EGFR in HeLa cells is significantly degraded after 24 h of treatment with 100 nM CXCL11–Atz (P = 0.0002) or CXCL11–Ctx (P = 0.0014) compared to isotype controls. No significant difference was observed between CXCL11–Atz and CXCL12–Atz (P = 0.2643), while CXCL12–Ctx caused greater EGFR degradation than CXCL11–Ctx (P = 0.0146); n = 3 biologically independent experiments. h,i, Fold change in abundance of surface-enriched (h) or whole-cell (i) MDA-MB-231 proteins detected using quantitative proteomics analysis after 48 h of treatment with 100 nM CXCL12–Atz reveals highly selective PD-L1 degradation. j,k, Fold change in abundance of surface-enriched (j) or whole-cell (k) HeLa proteins detected using quantitative proteomics analysis after 48 h of treatment with 100 nM CXCL12–Ctx reveals highly selective EGFR degradation. Data are the mean of n = 2 biological independent experiments and two technical replicates. Proteins showing a greater than twofold change from PBS control with a significance of P < 0.01 were considered significantly changed. l, In vitro potency of CXCL12–Tras in MDA-MB-175VII cells demonstrates superior cell killing versus Tras IgG; n = 2 biologically independent experiments and three technical replicates. m, Quantification of CXCL12–Tras plasma levels in male nude mice injected intravenously at 5, 10 or 15 mg per kg (body weight); n = 3 different mice per group. Densitometry was used to calculate protein levels, and data were normalized to whole protein levels. Data are represented as mean values, and error bars represent the standard deviation of biological replicates. P values for CXCL11 data were determined by one-way ANOVA with Sidak’s multiple comparisons test. P values for cell viability assays were determined by unpaired two-tailed t-tests at each indicated dose.

