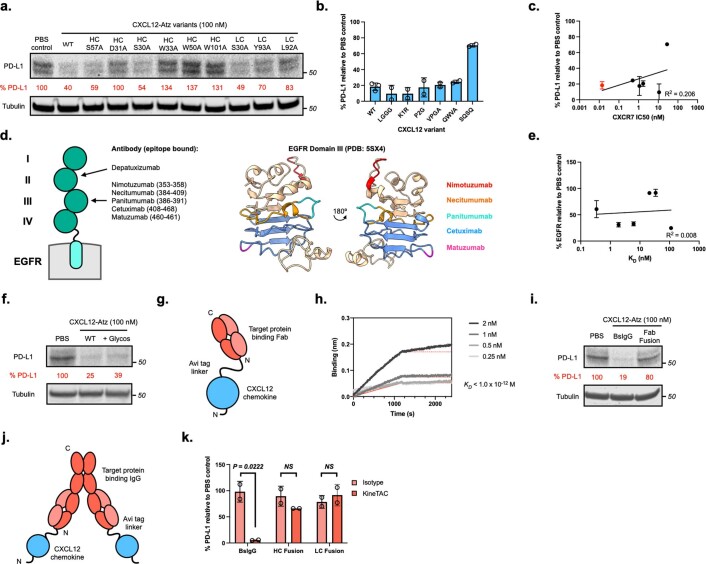
Extended Data Fig. 4. Requirements for efficient KineTAC-mediated degradation.
a, Representative western blot showing PD-L1 levels after treatment with 100 nM CXCL12-Atz wild-type or alanine mutants for 24 hr in MDA-MB-231 cells. b, PD-L1 levels after treatment with CXCL12-Atz wild-type or CXCL12 N-terminal variants (100 nM) for 24 hr in MDA-MB-231 cells. c, Trend of PD-L1 levels to CXCR7 IC50 (nM) of CXCL12 variants after treatment with 100 nM CXCL12-Atz variants for 24 hrs in MDA-MB-231 cells. Wild-type CXCL12 is indicated in red. N = 3 biologically independent experiments. d, Schematic of EGFR extracellular domains (I-IV) with locations of anti-EGFR antibody epitopes (left) and crystal structure of domain III (PDB: 5SX4) with the epitopes of anti-EGFR binders highlighted in their respective colors. e, Trend of EGFR levels to KD after treatment with 100 nM CXCL12-Depa, Nimo, Pani, Neci, Matu, or Ctx for 24 hrs in HeLa cells. N = 3 biologically independent experiments. f, PD-L1 levels after treatment with 100 nM aglycosylated or glycosylated CXCL12-Atz for 24 hr in MDA-MB-231 cells. g, Schematic of CXCL12-Atz Fab fusion construct where CXCL12 chemokine is fused to the N-terminus of atezolizumab Fab via an Avi tag linker. h, Multipoint BLI measurement of CXCL12-Atz Fab fusion shows high affinity to PD-L1 Fc fusion. i, PD-L1 levels after treatment with 100 nM CXCL12-Atz bispecific or Fab fusion for 24 hr in MDA-MB-231 cells. j, Schematic of CXCL12-Atz IgG fusion construct where CXCL12 chemokine is fused to the N-terminus of the heavy chain (HC) or light chain (LC) of atezolizumab IgG via an Avi tag linker. k, PD-L1 levels were significantly reduced in MDA-MB-231 cells after 24 hr treatment with 100 nM CXCL12-Atz bispecific (P = 0.0222) but not with HC or LC IgG fusions (P = 0.2239 and 0.5202, respectively) compared to isotype controls. N = 2 biologically independent experiments. Densitometry was used to calculate protein levels and normalized to PBS control. Data are represented as mean values and error bars represent the standard deviation of biological replicates. P-values were determined by unpaired two-tailed t-tests.

