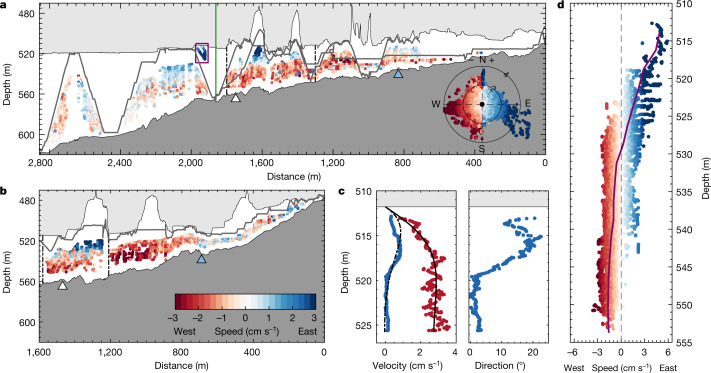
Fig. 4. Cross-sections and vertical profiles of current speed and direction.
a,b, Flow speed and direction in the grounding-zone region from an ADCP mounted on the Icefin remotely operated underwater vehicle for transect T1 (a) and transect T2 (b) (see inset panel in Fig. 1). Individual data points are coloured by flow speed, with blue colours indicating flow to the east (into the page) and red colours indicating flow to the west (out of the page). The vehicle track is indicated by the grey line, with the ice shelf and seabed indicated by the light grey and dark grey patches, respectively. The green line in a marks the location of the borehole, and the purple box indicates the region of the water column plotted in c. Inset in a is geographic velocity vectors coloured by flow speed for the combined data from T1 and T2. Radial contours indicate flow speed in cm s−1. Triangles in a and b mark the location of historic grounding-line locations estimated from satellite interferometry in 2011 (white) and the furthest downstream estimate in 2016 (blue)18. c, u eastward velocity (blue), v northward velocity (red) and geographic flow direction within 14 m of the ice base about 2,000 m from the grounding zone along T1 (purple box in panel a). The dot-dashed and solid black lines show the u (dot-dashed) and v (solid) velocity profiles from an analytical model of an under-ice Ekman boundary layer. d, Average velocity profile coloured by flow speed for all velocity data between 1,300 m and 1,800 m from the grounding zone along transect T1 (black dot-dashed lines in panel a) and between 1,210 m and 1,580 m from the grounding zone along transect T2 (black dot-dashed lines in panel b).

