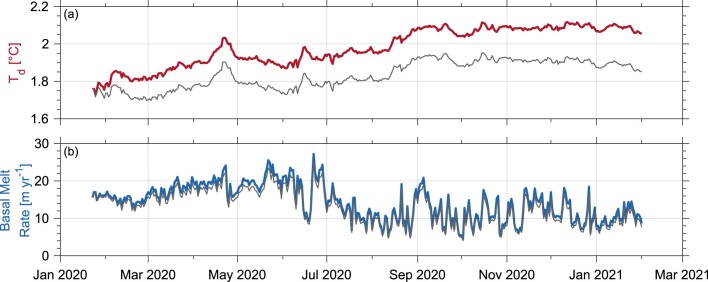
Extended Data Fig. 2. Thermal driving and basal melt rate from the three-equation melt-rate model.
a,b, Daily averaged time series of thermal driving (red) (a) and basal melt rate (blue) (b) predicted by the three-equation melt-rate model (see Methods). The grey lines in a and b show the thermal driving and basal melt rate corrected for effects of ice-base recession using the vertical profiles of Θ and SA from the CTD data (see Methods).

