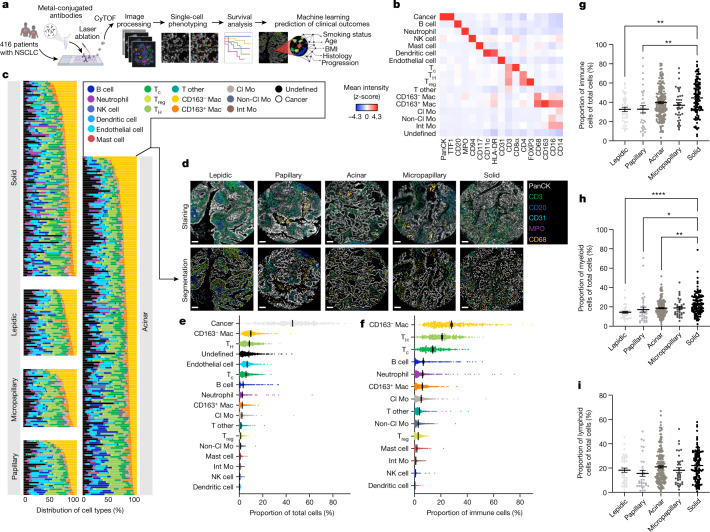
Fig. 1. IMC defines the spatial landscape of LUAD.
a, Schematic depicting IMC acquisition of multiplexed images from 416 patients with LUAD, single-cell phenotyping, survival and machine learning prediction of clinical outcomes. CyTOF, cytometry by time of flight. Images were created with BioRender. b, Average expression of lineage markers across cell types in the LUAD tissue using the panel of isotope-conjugated antibodies. Cl Mo, classical monocyte; Int Mo, intermediate monocyte; Mac, macrophage; NK, natural killer; non-Cl Mo, non-classical monocyte; Tc, cytotoxic T cell; TH, helper T cell. c, Waterfall plot depicting the distribution of 16 stromal and immune cell types across histological subgroups. d, Representative images of antibody staining and corresponding single-cell segmented images across histological subgroups. Scale bars, 100 μm. e,f, Prevalence of 17 cell types, including 14 immune cell types, across 416 patients with LUAD as a proportion of total cells (e) and immune cells (f). g–i, Prevalence of all immune (g), myeloid (h) and lymphoid (i) cells across lepidic (n = 40), papillary (n = 33), acinar (n = 190), micropapillary (n = 35) and solid (n = 118) architectural patterns as a proportion of total cells. Comparison between lepidic and solid (immune cells): **P = 0.0013. Comparison between papillary and solid (immune cells): **P = 0.0039. Comparison between lepidic and solid (myeloid cells): ****P ≤ 0.0001. Comparison between papillary and solid (myeloid cells): *P = 0.0474. Comparison between acinar and solid (myeloid cells): **P = 0.0072. Data shown as mean ± s.e.m. (e–i). One-way ANOVA with Tukey multiple comparison test was used for statistical analysis (g–i).

