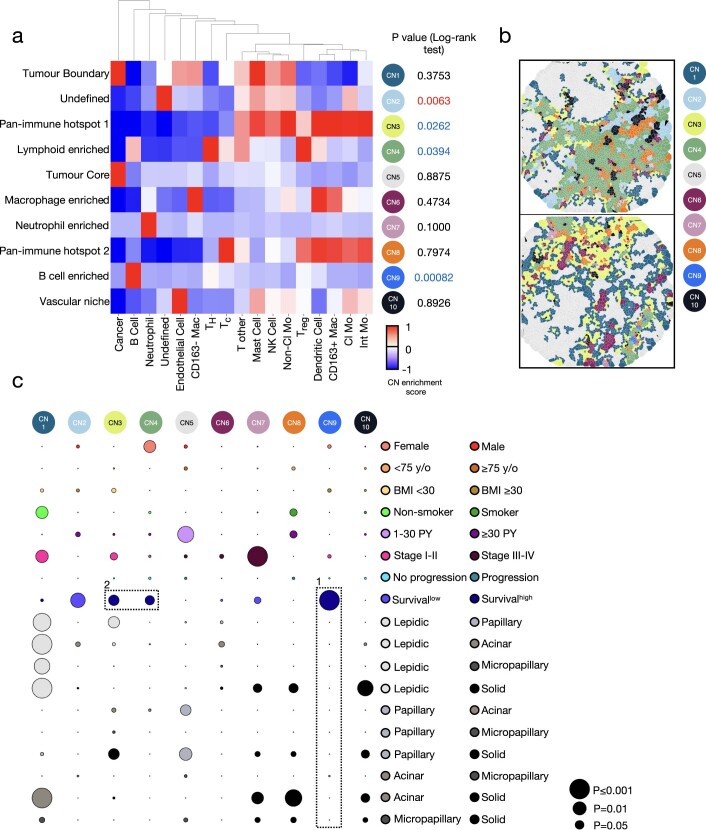
Extended Data Fig. 7. Variability in 10 cellular neighbourhoods across clinical variables in lung adenocarcinoma.
a, Heatmap of 10 cellular neighbourhoods discovered in 416 lung adenocarcinoma patients. b, Representative images of 10 cellular neighbourhoods using Voronoi diagrams. c, Bubble plot where circle colour indicates which of the two comparisons on the y-axis has higher levels of the cell type on the x-axis (Female n = 233, Male n = 183), age (<75 yo n = 369, ≥75 yo n = 47), BMI (<30 n = 346, ≥30 n = 70), smoking status (Smoker n = 376, Non-smoker n = 38), pack-years (1—30 n = 89, ≥30 n = 256), stage (I-II n = 365, III-IV n = 50), progression status (Progression n = 64, No progression n = 340) and histological subgroup (Lepidic n = 40, Papillary n = 33, Acinar n = 190, Micropapillary n = 35, Solid n = 118). The size of the circle represents the level of significance. Survivallow refers to survival in the context of low (z score <0) prevalence of depicted 10 cellular neighbourhoods. The black boxes depict associations referenced in the text. For exact P values, see Supplementary Table 6. Statistical analysis (a: log-rank test, c: FDR-corrected two-tailed Student t-test for sex, age, BMI, smoking status, pack-years, stage, progression status; one-way ANOVA with Tukey multiple comparison test for histological subgroup; log-rank test for survival).

