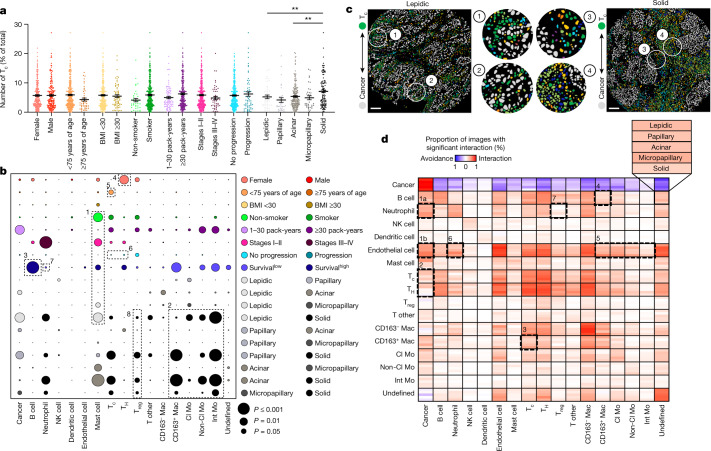
Fig. 2. Variability in single-cell distributions across clinical variables and in cell–cell interaction profiles across histological patterns in LUAD.
a, Prevalence of Tc cells (CD8+ T cells) across sex (female n = 233, male n = 183), age (younger than 75 years of age n = 369, 75 years of age or older n = 47), BMI (less than 30 n = 346, 30 or higher n = 70), smoking status (smoker n = 376, non-smoker n = 38), pack-years (1–30 n = 89, 30 or more n = 256), stage (I-II n = 365, III–IV n = 50), progression status (progression n = 64, no progression n = 340) and histological subgroup (lepidic n = 40, papillary n = 33, acinar n = 190, micropapillary n = 35, solid n = 118). Comparison between papillary and solid: **P = 0.0070, and acinar and solid: **P = 0.0076. Data shown as mean ± s.e.m. b, Bubble plot in which the circle size represents the level of significance and the circle colour indicates which of the two comparisons on the y axis has higher levels of the cell type on the x axis. Survivallow, survival in the context of low (z-score < 0) cell prevalence. For P values, see Supplementary Table 4. c, Segmented images showing increased interaction of cancer and Tc cells in lepidic versus solid predominant LUAD. Scale bars, 100 μm. d, Heat map depicting significant pairwise cell–cell interaction (red) or avoidance (blue) across the five histological subgroups (lepidic n = 40 images, papillary n = 33 images, acinar n = 190 images, micropapillary n = 35 images, solid n = 118 images; 1,000 permutations each). The black boxes depict associations referenced in the text. FDR-corrected two-tailed Student’s t-test for sex, age, BMI, smoking status, pack-years, stage and progression status; one-way ANOVA with Tukey multiple comparison test for histological subgroup; and log-rank test for survival were used for statistical analysis (a,b).

