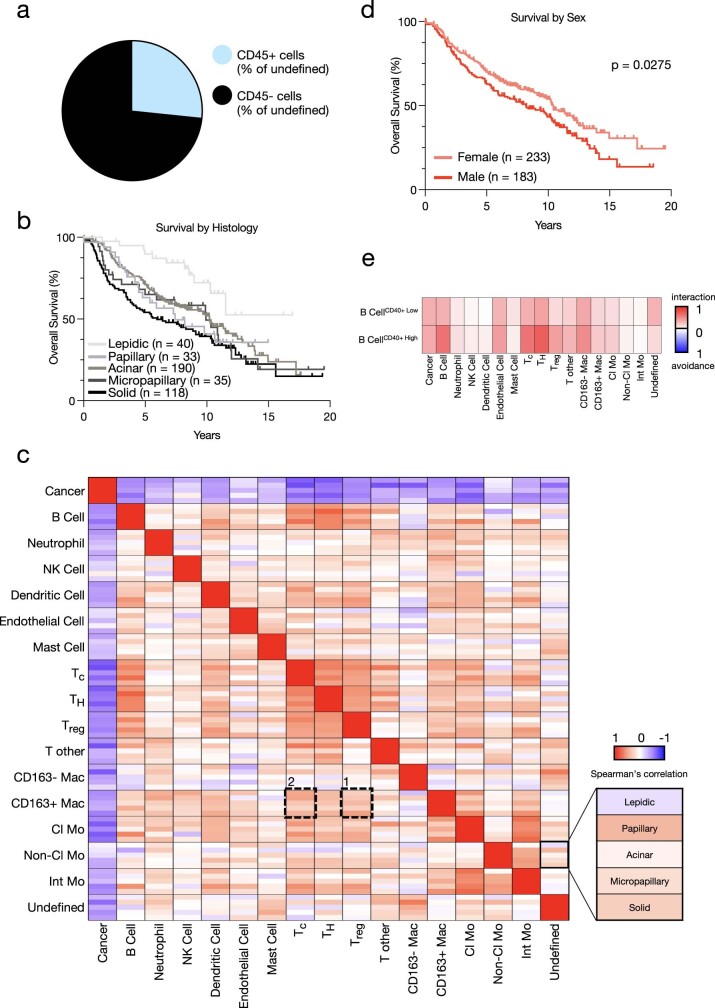
Extended Data Fig. 5. Survival analysis of distinct clinical variables.
a, Pie chart depicting the proportion of undefined cells that are CD45+ across 416 lung adenocarcinoma patients. b, Kaplan–Meier curves of overall survival for 416 lung adenocarcinoma patients based on histological subgroup (Lepidic n = 40, Papillary n = 33, Acinar n = 190, Micropapillary n = 35, Solid n = 118. For P values, see Supplementary Table 3. c, Heatmap depicting the Spearman’s rank correlation coefficient with high coefficients in red and low coefficients in blue between indicated cell types across the five histological subgroups (Lepidic n = 40 images, Papillary n = 33 images, Acinar n = 190 images, Micropapillary n = 35 images, Solid n = 118 images). d, Kaplan–Meier curves of overall survival for 416 lung adenocarcinoma patients based on sex (Female n = 233, Male n = 183). e, Heatmap depicting cell-cell interaction/avoidance among B cells in the CD40+ B cell high (z score ≥0; %total B cells) and CD40+ B cell low (z score <0; %total B cells) groups. Each rectangle depicts significant pairwise cell-type interaction (red) or avoidance (blue) between indicated cell types (n = 186 images for the CD40+ B cell high group; n = 230 images for the CD40+ B cell low group; 1,000 permutations each). Statistical analysis (b, d: log-rank test).

