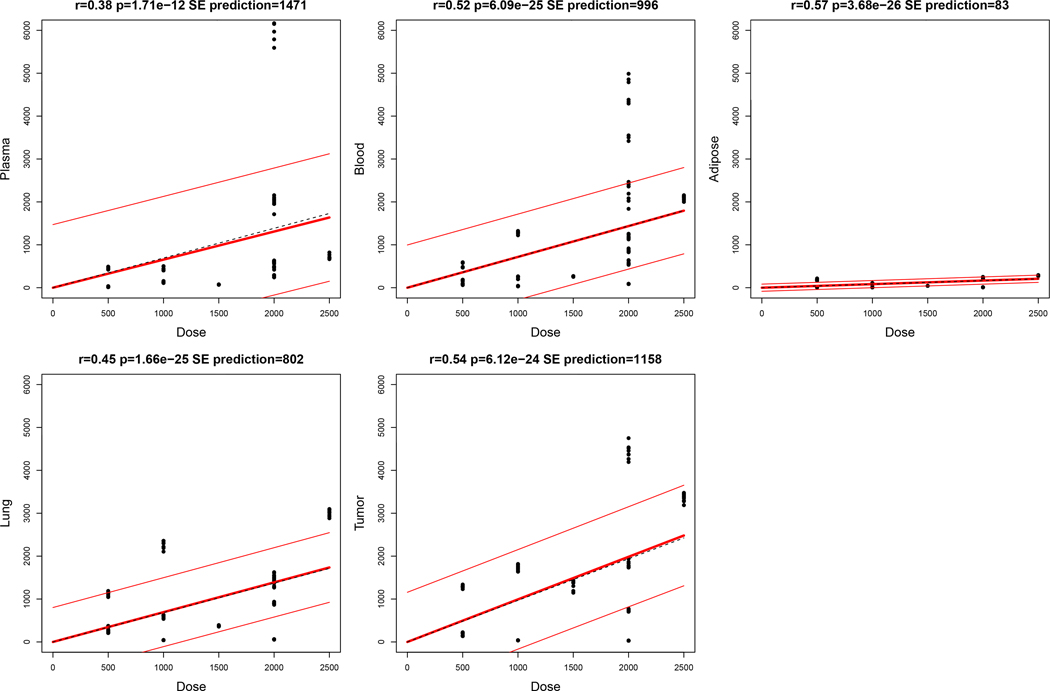
Fig. 1-. Daily dose of metformin correlates with tissue concentrations.
Concentrations of metformin in plasma, blood, adipose, lung tissue, and tumor tissue available from 12, 14, 7, 12, and 11 subjects were compared to daily dose. Correlation testing included all replicates with metformin concentrations ≥LLOQ. Regression lines (thick) are plotted ± standard error of prediction by regression (thin). p-value of slopes were determined by t-test compared to the null hypothesis.

