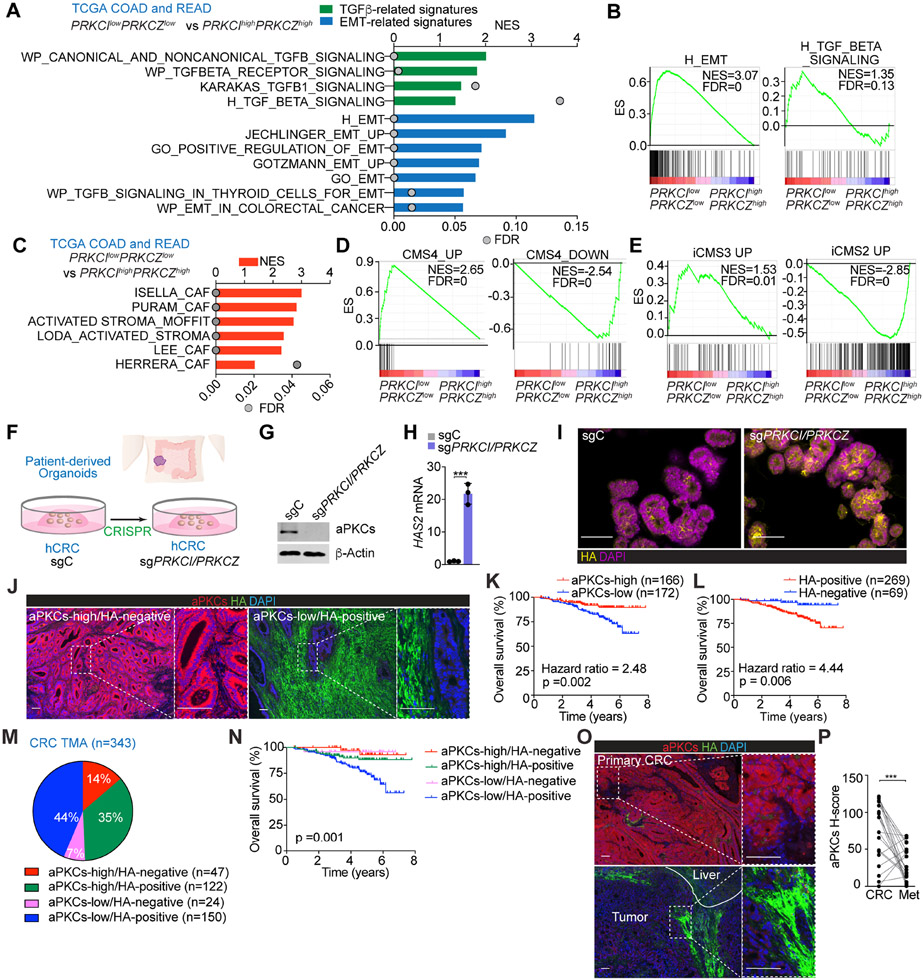
Figure 1. aPKC-low levels correlate with HA-deposition and poor prognosis in human CRC.
(A) GSEA of transcriptomic data from TCGA CRC patients according to PRKCI/PRKCZ expression.
(B) GSEA plots of the indicated gene signatures from TCGA CRC patients according to PRKCI/PRKCZ expression.
(C) GSEA of transcriptomic data from TCGA CRC patients according to PRKCI/PRKCZ expression using stroma-related signatures.
(D and E) GSEA plots of the indicated gene signatures in TCGA CRC patients according to PRKCI/PRKCZ expression.
(F) Experimental design of PRKCI and PRKCZ editing in patient-derived organoids (PDOs) from CRC.
(G) Immunoblot of indicated proteins in sgPRKCI/PRKCZ and sgC PDOs (n=3 biological replicates).
(H) qPCR of HAS2 in sgPRKCI/PRKCZ and sgC PDOs. Unpaired t-test. Data shown as mean ± SEM (n=3 biological replicates). ***p < 0.001.
(I) Immunofluorescence (IF) for HA (yellow) in sgPRKCI/PRKCZ and sgC PDOs. Scale bars, 50 μm
(J) IF for aPKCs (red) and HA (green) in a human cohort of CRC samples (n=390). Scale bars, 100 μm.
(K and L) Kaplan-Meier curve for overall survival of CRC patients according to aPKCs (K) and HA (L) expression. Log-rank tests.
(M and N) Pie chart of relative distribution of CRC patients according to aPKCs/HA expression (M) and Kaplan-Meier curve for overall survival. Log-rank test (N).
(O and P) IF for aPKCs (red) and HA (green) (O) and quantification (P) in primary CRC samples and metastatic counterparts (n=21, paired). Paired t-test. ***p < 0.001. Scale bars, 100 μm.
See also Figure S1.

