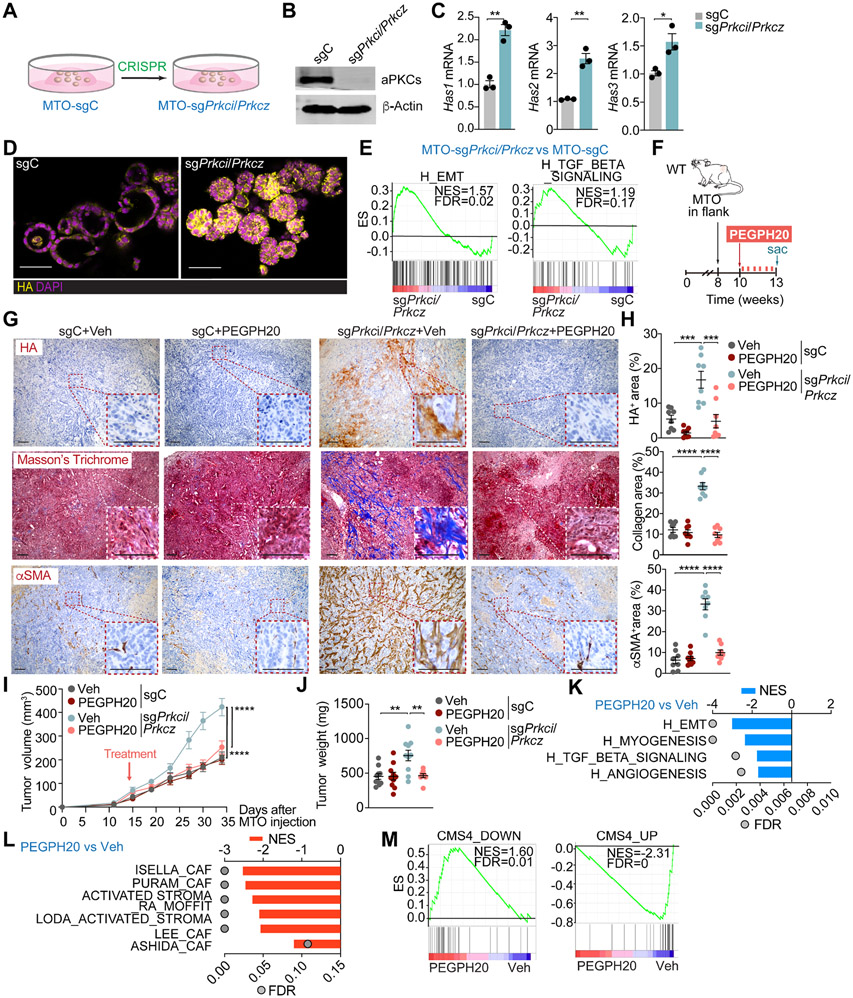
Figure 2. Targeting HA disrupts the desmoplastic response and impairs mesenchymal tumorigenesis.
(A) Experimental design of Prkci and Prkcz editing in mouse tumor organoids (MTO).
(B) Immunoblot analysis of indicated proteins in MTO-sgPrkci/Prkcz and MTO-sgC (n=3 biological replicates).
(C) qPCR of indicated genes in MTO-sgPrkci/Prkcz and MTO-sgC (n=3 biological replicates). Unpaired t-test. Data shown as mean ± SEM. *p < 0.05, **p< 0.01.
(D) IF for HA (yellow) in MTO-sgPrkci/Prkcz and MTO-sgC. Scale bars, 50 μm.
(E) GSEA plots of the indicated gene set signatures for MTO-sgPrkci/Prkcz versus MTO-sgC (n=3 biological replicates).
(F-J) Subcutaneous injection of MTO-sgPrkci/Prkcz and MTO-sgC in WT mice. Mice were treated twice a week with Veh or PEGPH20 0.0375 mg/kg for 3 weeks (MTO: sgC Veh n=10, sgC PEGPH20-treated n=10, sgPrkci/Prkcz Veh n=10, and sgPrkci/Prkcz PEGPH20-treated n=8). Experimental design (F); Immunohistochemistry (IHC) for HA, Masson’s trichrome, and αSMA staining (G); quantification, one-way ANOVA and post hoc Tukey’s test, data shown as mean ± SEM, (n=8), ***p < 0.001, ****p < 0.0001 (H); tumor volume, two-way ANOVA and post hoc Tukey’s test, data shown as mean ± SEM, ****p < 0.0001 (I) and tumor weight, one-way ANOVA and post hoc Tukey’s test, data shown as mean ± SEM, **p< 0.01 (J). Scale bars, 100 μm. Sac: sacrificed.
(K and L) GSEA from Quant-seq on MTO-sgPrkci/Prkcz PEGPH20-treated tumors (n=4) versus Veh (n=3) using compilation H (MSigDB) (K) and stroma-related signatures (L).
(M) GSEA plots of the indicated gene signatures for MTO-sgPrkci/Prkcz PEGPH20-treated tumors (n=4) versus Veh (n=3).
See also Figure S2.

