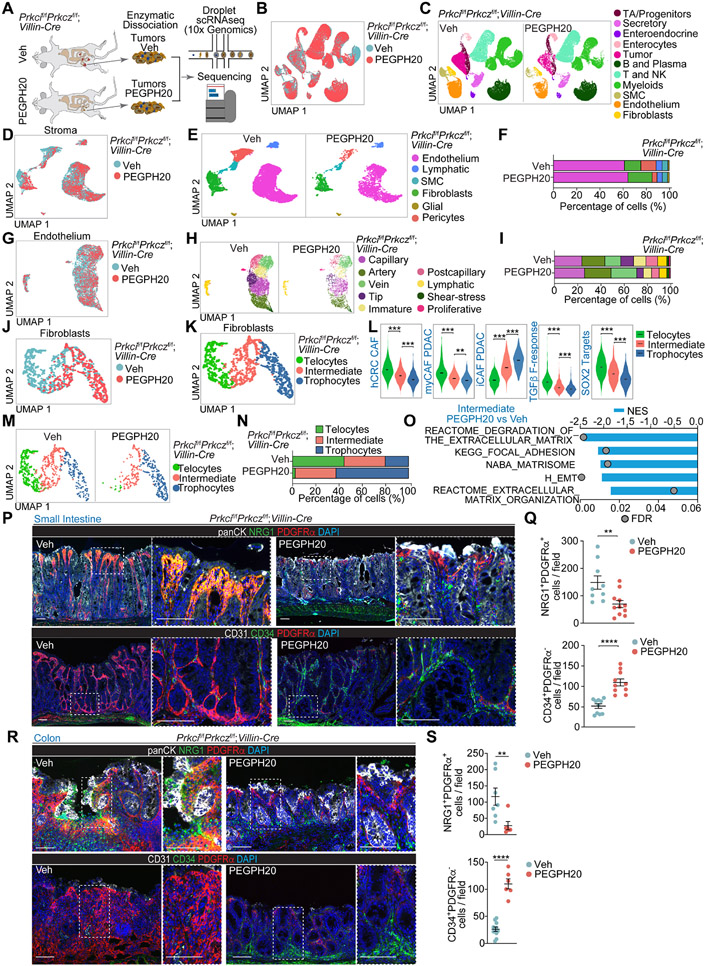
Figure 4. Remodeling of the mesenchymal intestinal tumor stroma by PEGPH20 treatment.
(A) Experimental design and workflow of scRNAseq. Small intestinal tumors from Veh (n=5) and PEGPH20-treated mice (n=3) were dissected and digested into single-cell suspensions for sequencing.
(B and C) Uniform manifold approximation and projection (UMAP) of tumor cells colored by treatment (B) and by the major cellular compartments (C).
(D and E) UMAP of stromal cells colored by treatment (D) and by the major stromal cell type (E).
(F) Stromal-cell-type percentage relative to the total stromal cells count per treatment.
(G and H) UMAP of endothelial cells colored by treatment (G) and by endothelial cell type (H).
(I) Endothelial-cell-type percentage relative to the total stromal cells count per treatment.
(J and K) UMAP of fibroblast colored by treatment (J) and by fibroblast cell type (K).
(L) Violin plots for the indicated gene signatures in the fibroblast cell types. The top and bottom of the violin plots represent the minimal and maximal values, and the width is based on the kernel density estimate of the data, scaled to have the same width for all clusters. Horizontal lines represent median values. Unpaired t-test, **p< 0.01, ***p < 0.001.
(M and N) UMAP of fibroblast colored by fibroblast cell type (M) and fibroblast-cell-type percentage relative to the total fibroblast count per treatment (N).
(O) Significantly enriched extracellular matrix (ECM)-related signatures in intermediate fibroblast treated with PEGPH20 versus Veh.
(P and Q) PDGFRα staining (red) with NRG1 (green) and panCK (white), CD34 staining (green) with PDFGRα (red) and CD31 (white) (P), and quantification, unpaired t-test, data shown as mean ± SEM, **p< 0.01, ****p < 0.0001 (Q) in Veh- and PEGPH20-treated small intestine tumors (n=5).
(R and S) PDGFRα staining (red) with NRG1 (green) and panCK (white), CD34 staining (green) with PDFGRα (red) and CD31 (white) (R), and quantification, unpaired t-test and Mann-Whitney test, data shown as mean ± SEM, **p< 0.01, ****p < 0.0001 (S) in Veh- and PEGPH20-treated colon tumors (n=3). Scale bars, 100 μm.
See also Figures S4 and S5.

