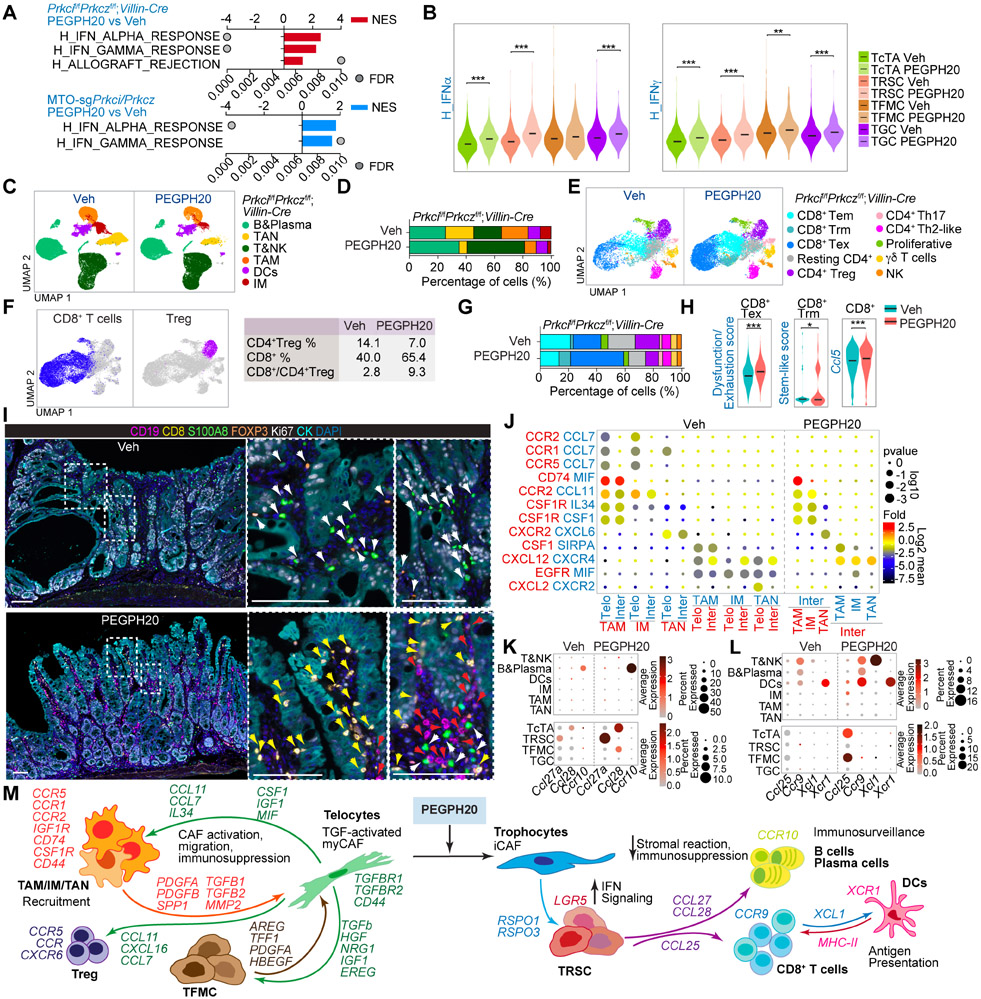
Figure 6. HA induces immunosuppression and impairs immunosurveillance in mesenchymal intestinal tumors.
(A) GSEA of transcriptomic data from Quant-seq on Prkcif/fPrkczf/f;Villin-Cre PEGPH20-treated tumors versus Veh (n=3) (top), and MTO-sgPrkci/Prkcz PEGPH20-treated tumors (n=4) versus Veh (n=3) (bottom) using compilation H (MSigDB).
(B) Violin plots for the indicated gene signatures in TcTAs, TRSCs, TFMCs, and TGCs treated with Veh or PEGPH20. The top and bottom of the violin plots represent the minimal and maximal values, and the width is based on the kernel density estimate of the data, scaled to have the same width for all clusters. Horizontal lines represent median values. Unpaired t-test, **p < 0.01, ***p < 0.001.
(C and D) UMAP of all immune cells colored by the major immune cell type (C) and immune-cell-type percentage relative to the total immune cells count per treatment (D).
(E and F) UMAP of all T cells colored by the T cell type (E) and canonical lineage marker expression for CD8+T cell and CD4+Treg (left) showing the percentage of CD4+Treg, CD8+T, and CD8+T:CD4+Treg ratio per treatment (right) (F).
(G) T-cell-type percentage relative to the total T cells count per treatment.
(H) Violin plots for the indicated gene signatures in CD8+T cells treated with Veh or PEGPH20. The top and bottom of the violin plots represent the minimal and maximal values, and the width is based on the kernel density estimate of the data, scaled to have the same width for all clusters. Horizontal lines represent median values. Unpaired t-test, *p < 0.05, ***p < 0.001.
(I) Seven-color overlay image for the indicated protein staining in Veh- and PEGPH20-treated tumors (n=3). Scale bars, 100 μm. The white arrows denote CD4+Treg and myeloid cells; the yellow arrows mark CD8+T cells and the red arrows point to B cells.
(J) CellphoneDB analysis of ligand-receptor pairs of cytokines between telocytes, intermediate and myeloid cells in Veh- or PEGPH20-treated tumors.
(K and L) Dot plot of ligand-receptor pairs of Ccl27a/Ccl28-Ccr10 (K) and Ccl25-Ccr9 and Xcl1-Xcr1 (L) between tumor epithelial cells and immune cells in Veh- or PEGPH20-treated tumors.
(M) Predicted regulatory crosstalk between tumor epithelial cells, fibroblasts, and the immune system in Veh- or PEGPH20-treated tumors.
See also Figure S8.

