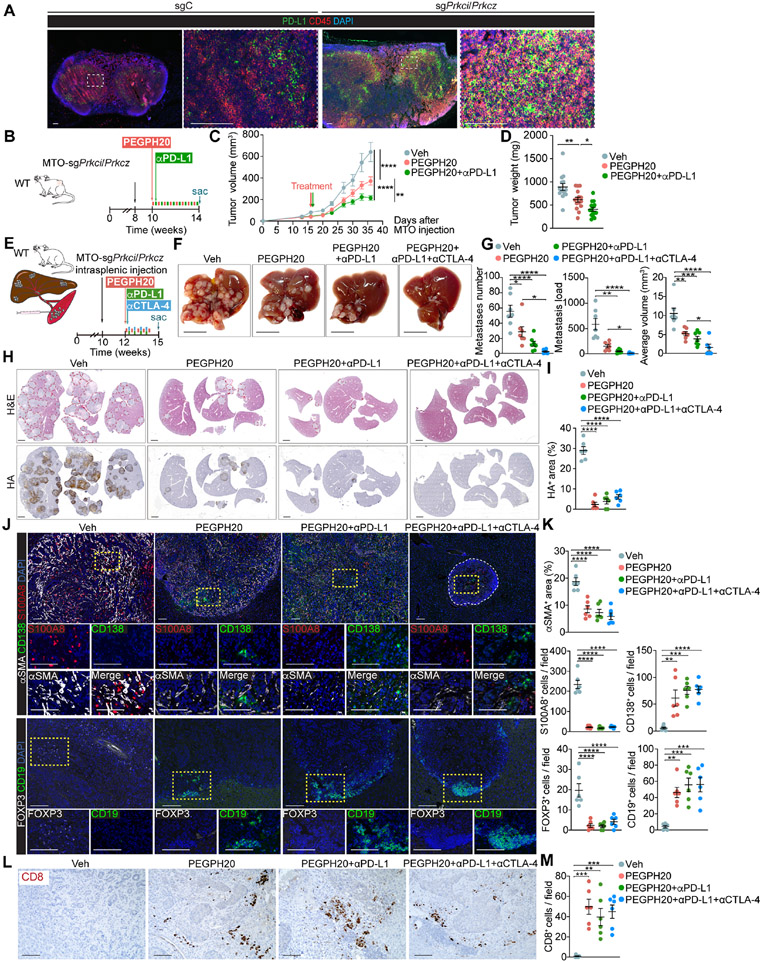
Figure 7. The combination therapy of PEGPH20 with anti-PDL1 improves the response of mesenchymal CRC tumors.
(A) IF for PD-L1 (green) and CD45 (red) of tumor-draining lymph nodes in MTO-sgC and MTO-sgPrkci/Prkcz. Scale bars, 100 μm.
(B-D) Subcutaneous injection of MTO-sgPrkci/Prkcz in WT mice treated twice a week with PEGPH20 (0.0375 mg/kg) and αPD-L1 (5 mg/kg) for 4 weeks (n:Veh= 14, PEGPH20-treated=15 and PEGPH20-treated with αPD-L1=15). Experimental design (B); tumor volume, two-way ANOVA and post hoc Tukey’s test, data shown as mean ± SEM, **p < 0.01, ****p < 0.0001 (C); tumor weight, one-way ANOVA and post hoc Tukey’s test, data shown as mean ± SEM, *p < 0.05, **p < 0.01 (D). Sac: sacrificed.
(E-M) Intrasplenic injection of MTO-sgPrkci/Prkcz in WT mice. Mice were treated twice a week with Veh or PEGPH20 0.0375 mg/kg and/or αPD-L1 (5 mg/kg) and/or αCTLA-4 (100 μg/dose) for 2.5 weeks (n: Veh-treated =7, PEGPH20-treated=7, PEGPH20 and αPD-L1-treated =7, and PEGPH20 and αCTLA-4-treated=6). Experimental design (E); macroscopic images of liver metastasis tumors (F); total metastases number, tumor load, and average tumor volume, one-way ANOVA and post hoc Tukey’s test, data shown as mean ± SEM, *p < 0.05, **p < 0.01, ***p < 0.001, ****p < 0.0001 (G); H&E staining and IHC for HA (H) and quantification, one-way ANOVA and post hoc Tukey’s test, data shown as mean ± SEM, (n=4), ****p < 0.0001 (I); IF for αSMA (white), CD138 (green) and S100A8 (red), IF for FOXP3 (white) and CD19 (green) (J), and staining quantification, one-way ANOVA and post hoc Tukey’s test, data shown as mean ± SEM, **p < 0.01, ***p < 0.001, ****p < 0.0001 (K); CD8 staining (L) and quantification, one-way ANOVA and post hoc Tukey’s test, data shown as mean ± SEM, (n=3), **p < 0.01, ***p < 0.001 (M); in liver metastases (n=5). Scale bars, 10 mm (F), 2 mm (H), 100 μm (J, L). The red line denotates liver metastases (H). Sac: sacrificed.
See also Figure S9.

