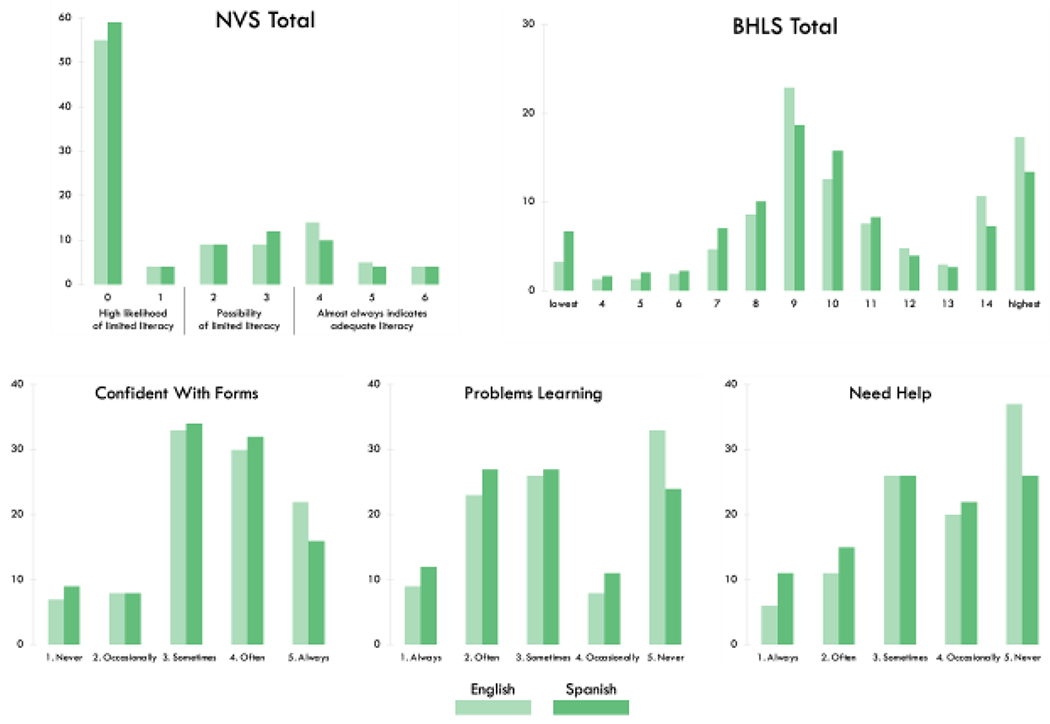
Figure 1.

Score Distributions for Total NVS Scores, Total BHLS scores, and Individual BHLS Items
Note. The weak correlation between NVS total scores (top left) and BHLS total scores (top right) is explained by the dissimilarity in their distributions. With few exceptions, scores for all measures were fairly consistent across languages. Results shown include NVS scores with up to one item missing (n = 81, English; n = 112, Spanish). Of those with a total NVS score of zero, one item was missing for n = 11 for English and n = 34 for Spanish. There were no missing data for BHLS scores.
