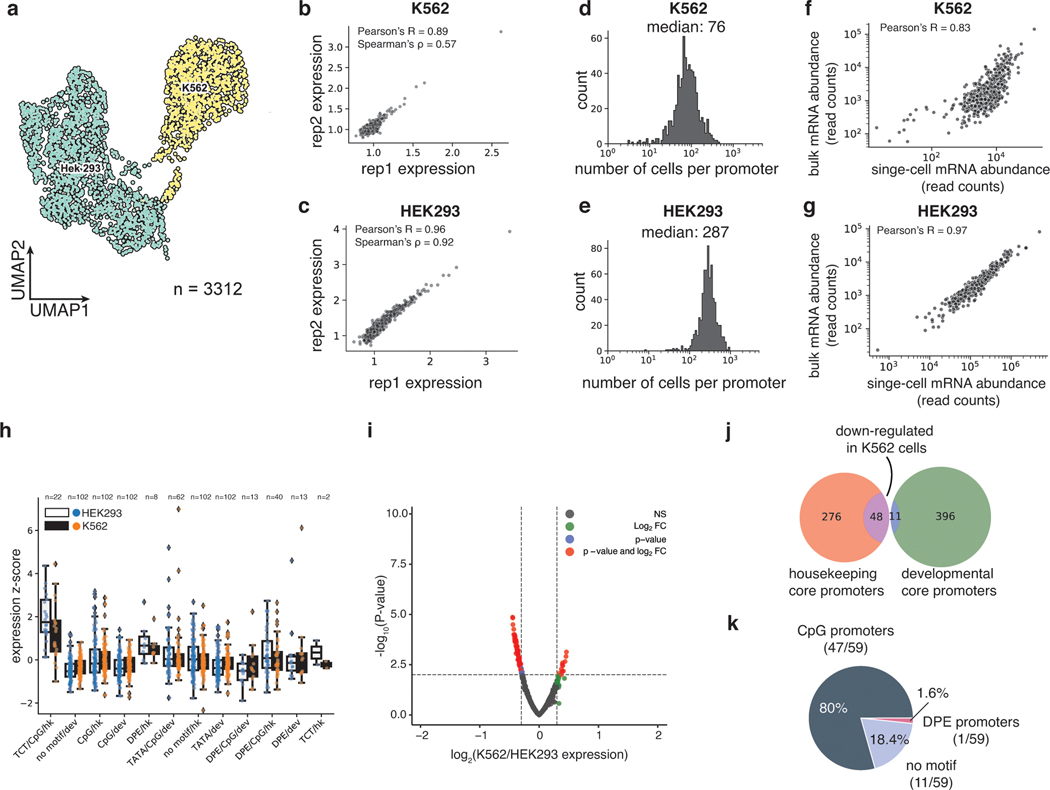
Fig. 2. scMPRA detects cell type specific CRS activity.
(a) UMAP of the transcriptome from the mixed-cell scMPRA experiment. 3312 out of 3417 cells are assigned to either K562 or HEK293 cells and visualised here. (b,c) Reproducibility of replicate measurements of the mean expression from each core promoter in both K562 and HEK293 cells. (d,e) Histogram of the number of cells in which each core promoter was measured for HEK293 and K562 cells. (f,g) Correlations between scMPRA and bulk MPRA using mRNA abundances (cBC counts per cell) to make the two methods comparable. (h) Boxplot of the activities of core promoters from different categories in K562 (orange) and HEK293 (blue) cells. The promoter categories are taken from Haberle et al.. Because the average expression of all promoters were different between K562 and HEK293, we plotted each category according to its deviation from the average expression (z-score) of all promoters in each cell type. (i) Volcano plot for differential expression (DE) of core promoters in K562 and HEK293 cells. Red dots represent significantly DE reporters (two-sided Wald test adjusted p-value <0.01 and log2-fold change greater than 0.3). (j) Venn diagram of the functional characterization (housekeeping vs developmental) of down-regulated core promoters in K562 cells. Housekeeping promoters are enriched (p-value = 1.08×10⁻¹¹ from two-sided hypergeometric test). (k) Pie chart of the sequence features (CpG, DPE, TATA) of down-regulated core promoters. CpG promoters are enriched (p=2.18×10⁻⁶, two-sided hypergeometric test).

