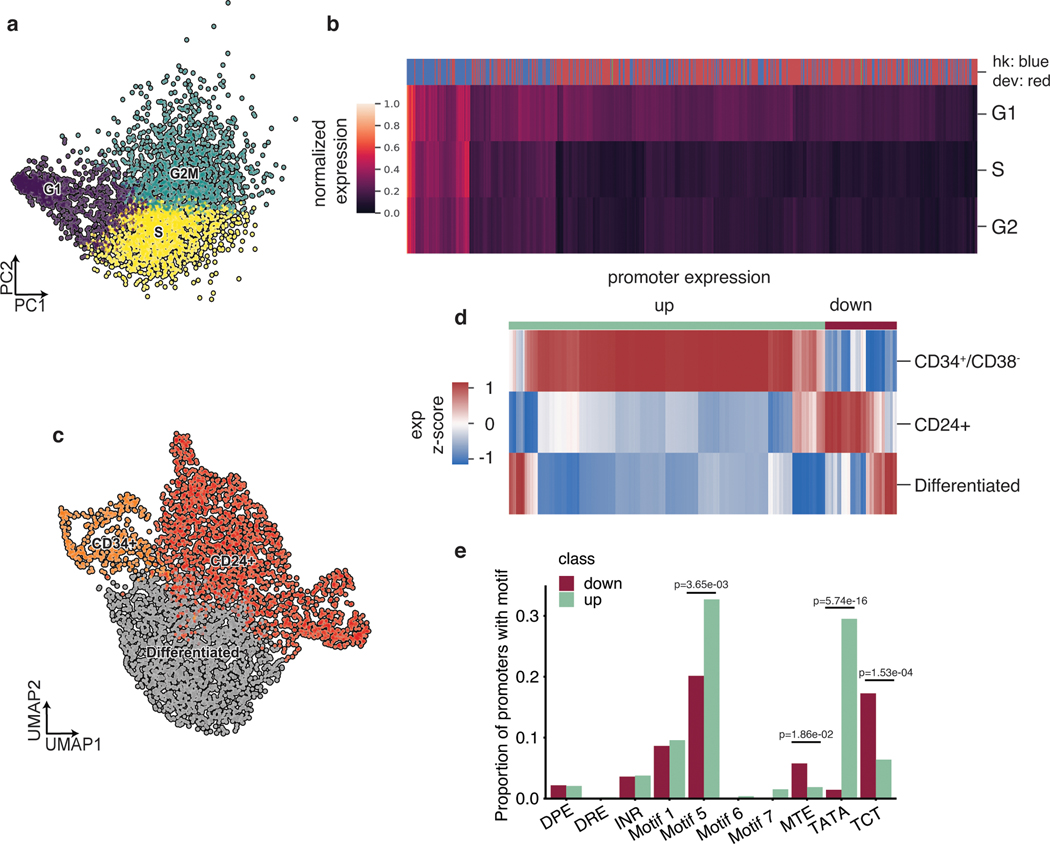
Fig. 3. scMPRA detects sub-state-specific CRS activity.
(a) PCA plot of K562 cells (n = 4041) classified by their cell cycle scores. (b) Heatmap of core promoter activities in different cell cycle phases (Color bar indicates housekeeping (blue) vs developmental (red) promoters). Core promoter activities have been normalized within each cell cycle phase to highlight the differences between housekeeping and developmental promoters. (c) UMAP embedding of K562 cells with high proliferation (CD34+/CD38− and CD24+) and undifferentiated substates. (d) Hierarchical clustering showing two clusters (“up” and “down”) based on expression patterns in the three substates. The promoter (n = 672) activities are plotted as their z-score from the average across cell states to highlight the difference between cell states. (e) Proportion of promoters in the up and down clusters that contain the indicated core promoter motif. Significant p-values from a two-sided Fisher’s exact test are shown.

