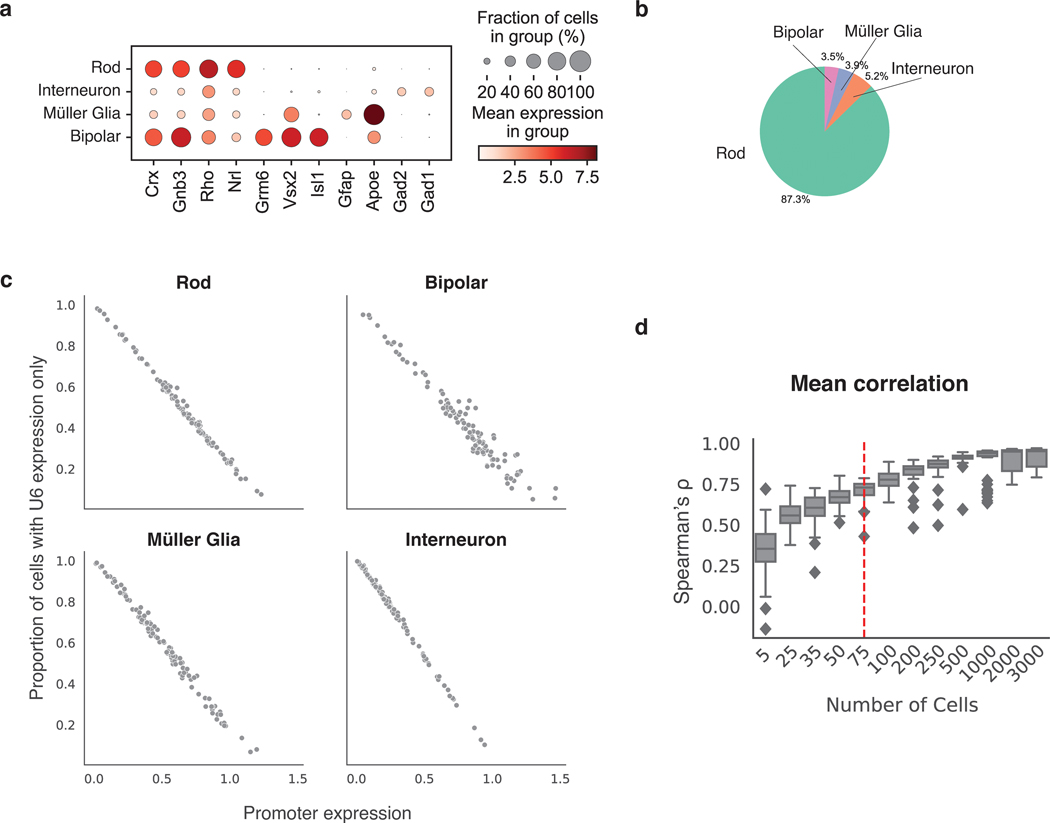
Extended Data Fig. 3. Robust measurements of Gnb3 promoter library in ex vivo retina.
(a) Expression of marker genes by scRNA-seq used to identify cell types in the retina. (b) Percentage of the total cells recovered represented by each retinal cell type. (c) Plot showing the relationship between the mean activity of a Gnb3 promoter variant in a given cell type (x-axis) and the proportion of cells in which that promoter variant is silent (y-axis). Individual cells in which a given Gnb3 variant is silent are identified as cells with U6-expressed cBC, but no Gnb3-expressed cBC. (d) The correlation between biological replicates (n=2) is plotted as a function of the number of cells used in the analysis. The bounds of the box represent the upper and lower quartiles respectively, and the center line represents the median. The whiskers extend to the maxima/minima except for points determined to be outliers using a method that is a function of the interquartile range.

