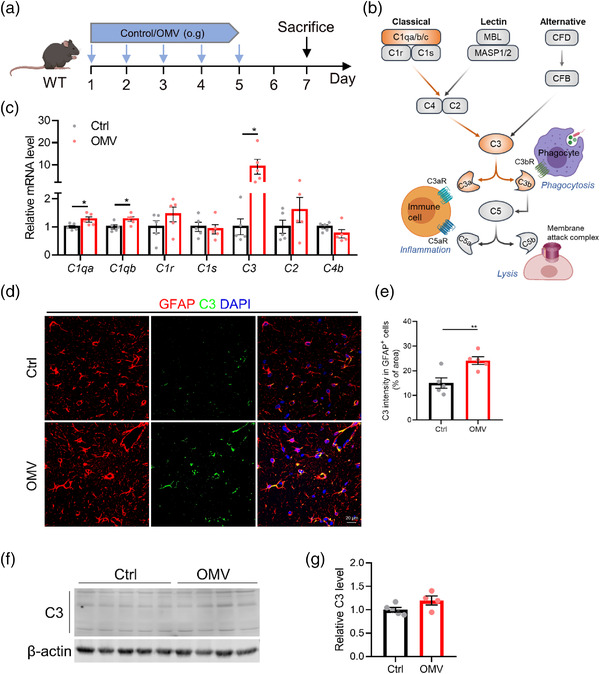
FIGURE 4.

Helicobacter pylori OMVs promote C3 activation in WT mice. (a) Treatment schedule of AppNL‐G‐F mice treated with control or H. pylori OMVs. (b) Simplified schematic of the complement pathway illustrating selected proteins. Proteins involved in the classical complement pathway and upregulated by H. pylori OMVs treatment are highlighted in orange. (c) Gene expression of complement components in the hippocampus. (d) Representative images of GFAP and C3 staining in CA3 region of hippocampus. Scale bars, 20 μm. (e) Quantification of the percentage of overlay area of C3 in astrocytes. (f) Western blot analysis of C3 expression in the hippocampus. Individual lanes are biological duplicates (n = 4 or 5). (g) Quantification of the relative C3 levels in the hippocampus. The graphs are shown as the mean ± SEM and the datapoints are biological replicates. Images are representative for 5 (d) biological replicates. Statistical significance was determined by two‐tailed Student's t‐test. *p < 0.05, **p < 0.01
