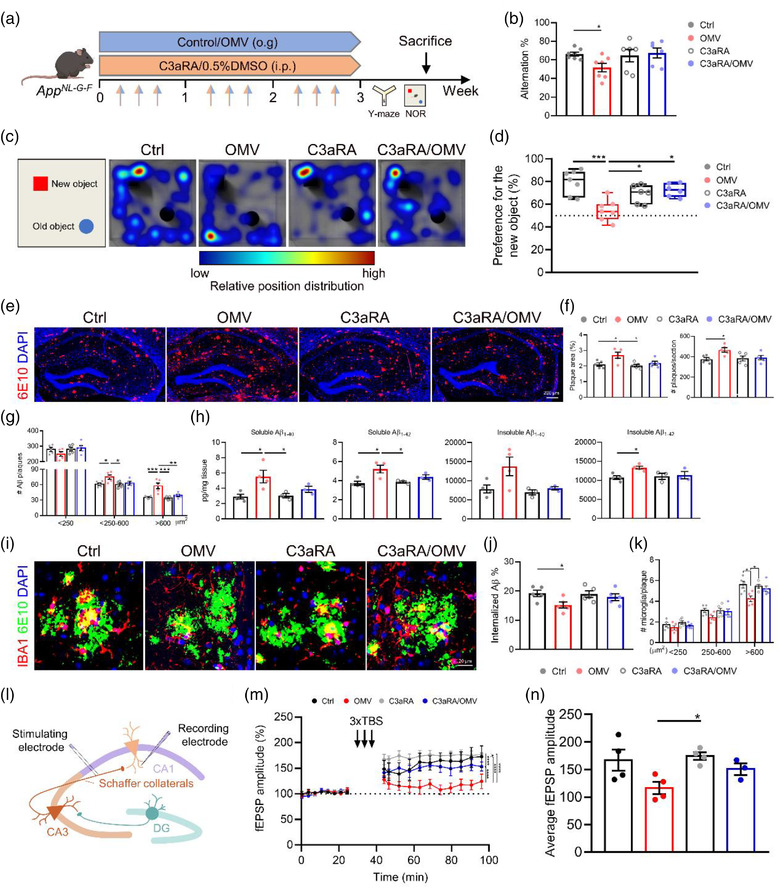
FIGURE 7.

C3aR antagonist treatment blocks the effects of Helicobacter pylori OMVs on AD pathology and memory function in AppNL‐G‐F mice. (a) Treatment schedule of AppNL‐G‐F mice treated with control/H. pylori OMVs and 0.5%DMSO/C3aRA. (b) Quantification of Y‐maze spontaneous alternation. (c) Representative heat maps of tracks in NOR test. (d) The percentage of NOR discrimination. (e) Representative images of 6E10 staining in the hippocampus. Scale bars, 200 μm. (f) Quantification of the plaque area (left) and number (right) in the hippocampus. (g) Quantification of Aβ plaque size distribution in the hippocampus. (h) Soluble and insoluble Aβ1‐40 and Aβ1‐42 levels in the hippocampus. (i) Representative images of IBA1 and 6E10 staining in the hippocampus. Scale bars, 20 μm. (j) Quantification of the percentage of overlay area of microglia and Aβ plaque. (k) Plaques were divided into small (< 250 μm2), medium (250‐600 μm2), and large (> 600 μm2), the number of microglia per plaque was quantified. (l) Schematic diagram indicating the general experimental set‐up of LTP measurement in AppNL‐G‐F mice. (m‐n) fEPSP amplitude recordings over time (m) and the average of the fEPSP amplitude recordings (n) after LTP induction in CA1 Schaffer collateral synapses. The graphs are shown as the mean ± SEM and the datapoints are biological replicates. Images are representative for 5 (c, e and i) or 3–4 (m and n) biological replicates. Statistical significance was determined by two‐way ANOVA Bonferroni's multiple comparisons. *p < 0.05, **p < 0.01, ***p < 0.001, ****p < 0.0001.
