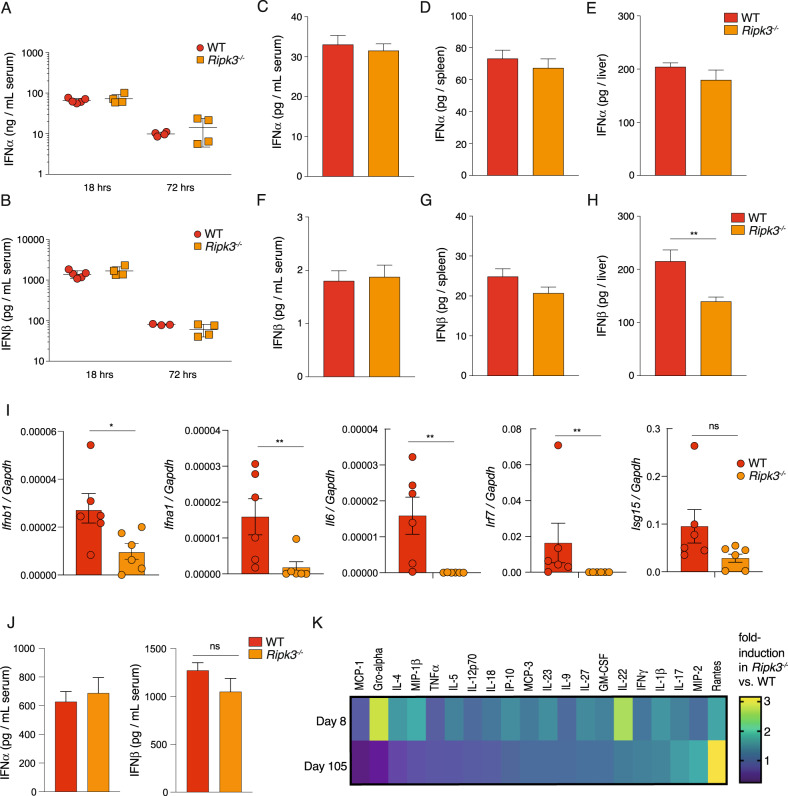
Fig. 6. Dampened IFN-I levels in livers and overall changes in circulating cytokines detected in Ripk3-/- mice during chronic LCMV infection.
Serum (A) IFNα or (B) IFNβ levels were quantified by ELISA, 18 h or 72 h after LCMV docile infection. C–E IFNα or (F–H) IFNβ levels were quantified in the serum and indicated organs 8 days post LCMV docile infection. (C–H) represent 8–9 mice per group. The mean and SEM are indicated. **p < 0.01 (unpaired t test). HRS hours. I q-RT PCR gene expression analysis (relative to Gapdh) of Ifnb1, Ifna1, Il6, Irf7 and Isg15 in whole livers from WT and RIPK3-deficient animals at 14 days post LCMV docile infection. The mean and SEM are indicated, **p < 0.01, *p < 0.05, ns > 0.05 (Mann–Whitney U test, two-tailed). (n = 6 mice per group). J IFNα or IFNβ levels in serum of WT or Ripk3−/− mice at 105 days post infection with LCMV docile, quantified by dual plex ELISA (per group: n = 6 WT, n = 6 Ripk3−/−). K Multiplex cytokine array was performed on sera collected from LCMV docile infected mice at 8 days and 105 days post infection. Heatmap represents average fold-change between WT and RIPK3-deficient mice at indicated time points (n = 4 mice per genotype).

