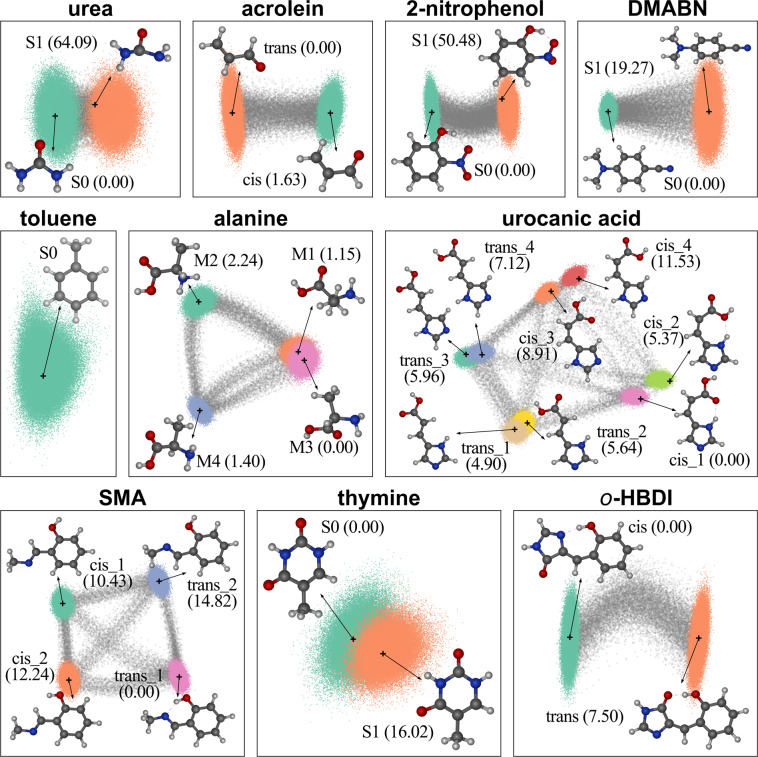
Fig. 3.
Illustration of the conformational diversity of the WS22 database showing equilibrium geometries of the considered conformers as well as principal component analysis (PCA) of all structures in each molecular dataset. In PCA, the molecular geometries were first converted into a pairwise nucleus-nucleus distance matrix descriptor with only unique off-diagonal elements and then normalized with a min-max scaling to use as input for the PCA projections. The gray markers represent geometries interpolated between pairs of accessible conformations, and the location of equilibrium structures on PCA plots are indicated by ‘+’ markers and arrows. The total energies of each conformer relative to the most stable one are shown in kcal mol−1 in parentheses.

