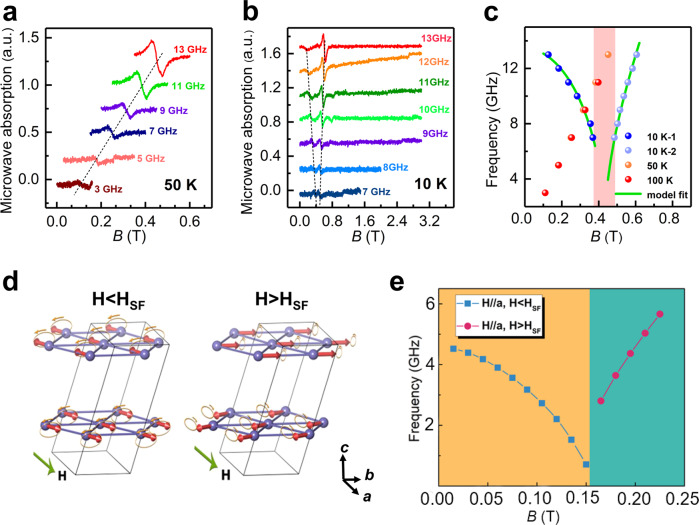
Fig. 4. The resonance modes associated with the SF transitions as H // a.
The representative field dependence of absorption spectra with frequency 3–13 GHz at a 50 K and b 10 K by AFMR measurements. c The magnetic field dependence of resonance frequency at different temperatures, with fitted result at 10 K by Landau−Lifshitz model. The field interval between two special resonance modes at 10 K is marked as shadow, corresponding to the SF transition. d Schematic representation of different magnon modes below and above the SF field. e The calculated magnon frequency vs magnetic field by DFT.

