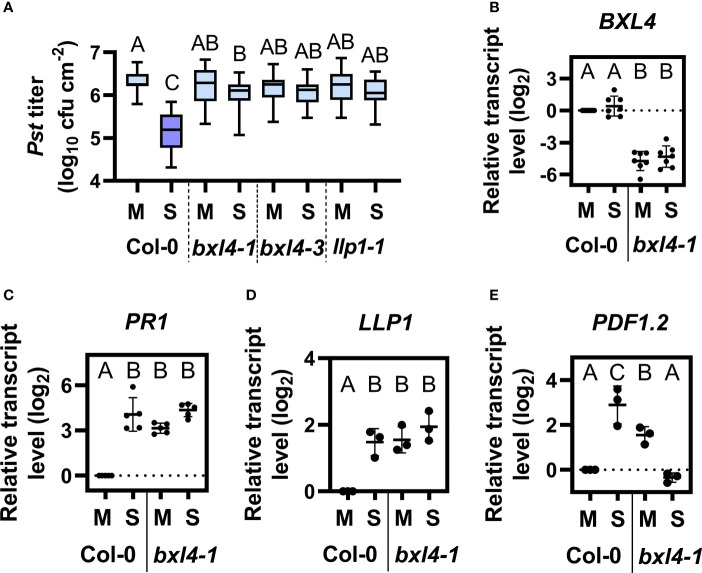
Figure 2.
BXL4 promotes systemic acquired resistance (SAR). Plants of the genotypes Col-0, bxl4-1, bxl4-3, and llp1-1 (as indicated below the panels) were syringe-infiltrated in the first two true leaves with either 106 for (A–C) or 107 (for D/E) cfu per mL of Pst/AvrRpm1 (S) or a corresponding mock (M) control solution. Distal uninfected leaves were examined for the transcript abundance of BXL4 (B, at 3 dpi), PR1 (C, at 3 dpi), LLP1 (D, at 1 dpi), or PDF1.2 (E, at 1 dpi). Alternatively, plants were challenged at 3 dpi with 105 cfu/mL of Pst to evaluate SAR. (A) In planta titers of Pst in systemic, challenge-inoculated leaves were measured at 4 dpi. Box plots represent average Pst titers from nine biologically independent experiments, including at least 3 replicates each ± min and max values. Letters above the box plots indicate statistically significant differences for means (one-way ANOVA and Tukey’s test for P=<0.05, F (28, 403)=21.02, Col-0 M n=33, Col-0 S n=37, bxl4-1 M n=40, bxl4-1 S n=42, bxl4-3 M n=21, bxl4-3 S n=22, llp1-1 M n=25, llp1-1 S n=25). (B–E) Transcript abundance of the genes was measured by qRT-PCR, normalized to that of UBIQUITIN, and is shown relative to the normalized transcript levels in the appropriate Col-0 mock (M) controls. Black dots represent three to seven biologically independent data points, and lines indicate the respective mean values ± SD. The letters above the scatter dot plots indicate statistically significant differences (one-way ANOVA and Tukey’s test, P=<0.05, for (B): n=7, F(5, 32)=68.60, for (C): n=5, F(5, 24)=20.68, for (D): n=3, F(3, 8)=29.80, for (E): n=3, F (3, 8)=16.74).

