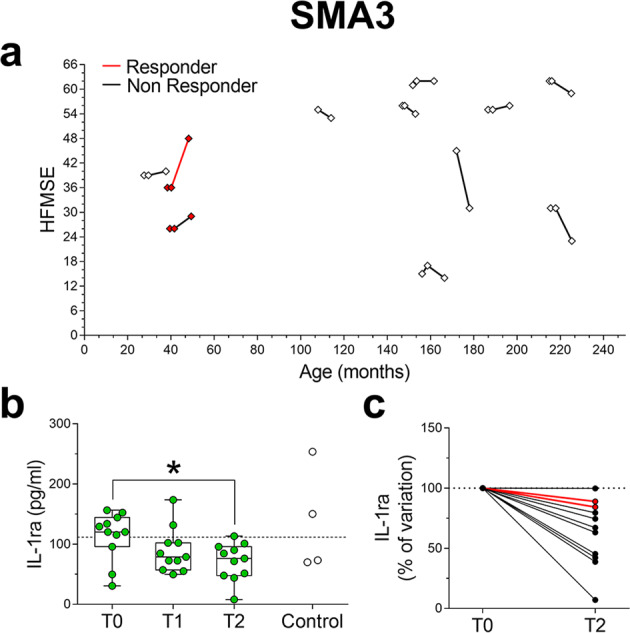
Fig. 4. IL-1ra levels are decreased by Nusinersen treatment in the CSF of SMA3 patients.

a Spaghetti plots representing the HFMSE score of each SMA3 patient prior to treatment (T0, n = 11) at the fourth (T1, n = 11) and/or sixth (T2, n = 11) injection of Nusinersen. b Levels of IL-1ra in the CSF of SMA3 patients prior to treatment (T0) and at the time of the fourth (T1) and the sixth (T2) injection of Nusinersen. Controls (n = 4) were used as a reference for physiological baseline levels of cytokines. The dotted line represents the median of control samples. Data are shown as box and whisker plots representing median with interquartile range (IQR). Dots represent individual patients’ values. *p < 0.05, compared to T0 (Wilcoxon matched-pairs signed ranks test). c Spaghetti plots showing variations of IL-1ra levels in the CSF of SMA3 patients between T0 and T2. Cytokines variations are expressed as percentage of the T0 values (expressed as 100%). Patients were indicated as “responders” (red lines) or “non-responders” (black lines) to Nusinersen therapy.
