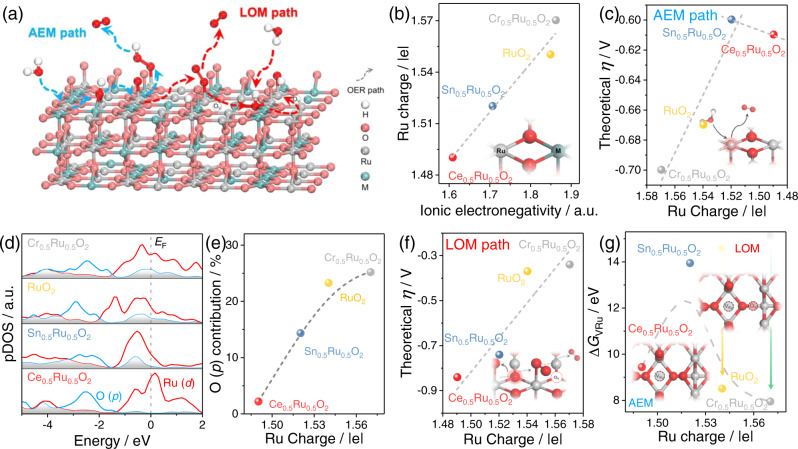
Fig. 2. Prediction of the OER performance based on DFT calculation.
a Schematics of two OER pathway (AEM and LOM) on the surface of M0.5Ru0.5O2 (110). b The variation of Ru charge in M0.5Ru0.5O2 with an ionic electronegativity of different M. c Theoretical overpotential volcano plot under AEM pathway as a function of the Ru charge. d Projected DOS plots of Ru (d) and O (p) near the Fermi level for M0.5Ru0.5O2. The light gray filling shows the overlap between Ru (d) and O (p). e Variation of O (p) contribution near Fermi level with Ru charge. f Theoretical overpotential plot under LOM pathway as a function of the Ru charge. g The Ru vacancy formation energy (ΔGVRu) of M0.5Ru0.5O2 is characterized by Ru charge. For RuO2 and Cr0.5Ru0.5O2, ΔGVRu were calculated without (transparent dots in yellow and green) and with (opaque dots in yellow and green) the consideration of lattice oxygen vacancies. Source data are provided as a Source Data file.

