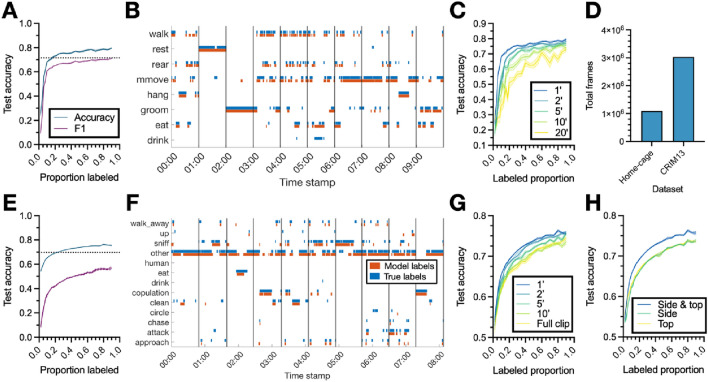
Figure 2.
Classifier performance. (A) Test set accuracy and overall F1 score of the classifier on the home-cage dataset as a function of the proportion of the dataset used to train it. The proportion of data denoted on the x-axis is used to train the classifier, which is then evaluated on the remainder of the dataset. (B) Sample ethogram of classifier labels and ground-truth annotations from 10 randomly selected home-cage clips. Each colored line indicates the label of that behavior at the corresponding time stamp. Vertical black lines denote the divisions of the video into clips (one minute in duration). (C) Test set accuracy on the home-cage dataset as a function of the proportion of data used to train the classifier, for clips of varying length (clip duration denoted in minutes). (D) Total number of annotated frames in each dataset. (E–G) Same as (A–C), but for the CRIM13 dataset. (H) Test set accuracy on the CRIM13 dataset as a function of the amount of training data for classifiers trained with features from the side camera, top camera, and both the side and top cameras. Lines and shaded regions in (A,C,E,G,H) indicate mean and standard error, respectively, across 10 random splits of the data.

