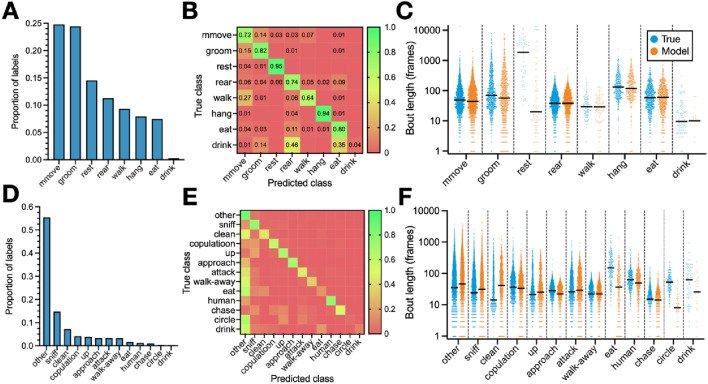
Figure 3.
Dataset behavior characteristics and classifier performance. (A) Ground-truth distribution of behavior labels (i.e., the number of frames in which each behavior occurs as a proportion of the total number of frames in the dataset) for the home-cage dataset. (B) Example confusion matrix showing the classifier performance by behavior on the home-cage dataset, with cell values normalized relative to the true class. (C) True bout lengths and example predicted bout lengths for the home-cage dataset, grouped by behavior. A single “bout” refers to a period of continuously occurring behavior, and the corresponding bout length to the length of that period in number of frames. Median bout length is marked by the solid black lines, and each dot corresponds to a single bout. (D–F) Similar to (A–C), but for the CRIM13 dataset.

