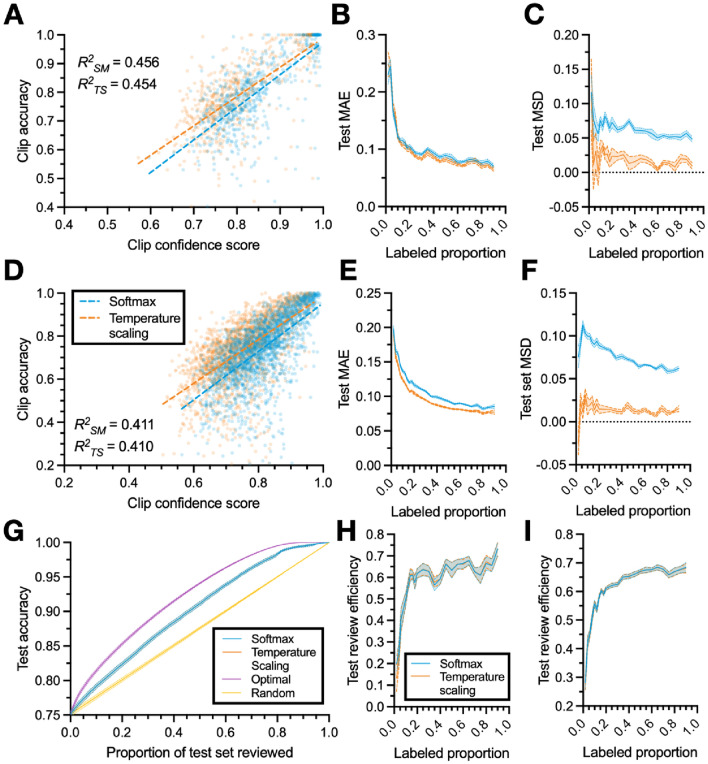
Figure 6.
Confidence measure improvements across training proportions. (A) Example of the correlation between clip confidence score and clip accuracy. Dashed lines indicating the line of best-fit with r-squared values inset. (B) Mean absolute error (MAE) and (C) mean signed difference (MSD) between clip confidence score and clip accuracy as a function of the amount of data used to train the classifier. (D–F) Similar to (A–C), but for the CRIM13 dataset. (G) Example relationship between the proportion of test clips reviewed (and corrected) and test set accuracy from the home-cage dataset, where clips are reviewed in an order determined by the confidence scoring method, for various scoring methods (see “Methods: Confidence-based review” section). (H) Review efficiency metric, quantifying how effectively a given confidence scoring method performs when low-confidence clips are reviewed first (see “Methods: Evaluating review efficiency” section) as a function of the amount of training data, for the home-cage dataset. (I) Same as (H), but for CRIM13. Lines and shaded regions in (B,C,E,F,H,I) indicate mean and standard error across 10 random splits of the data.

