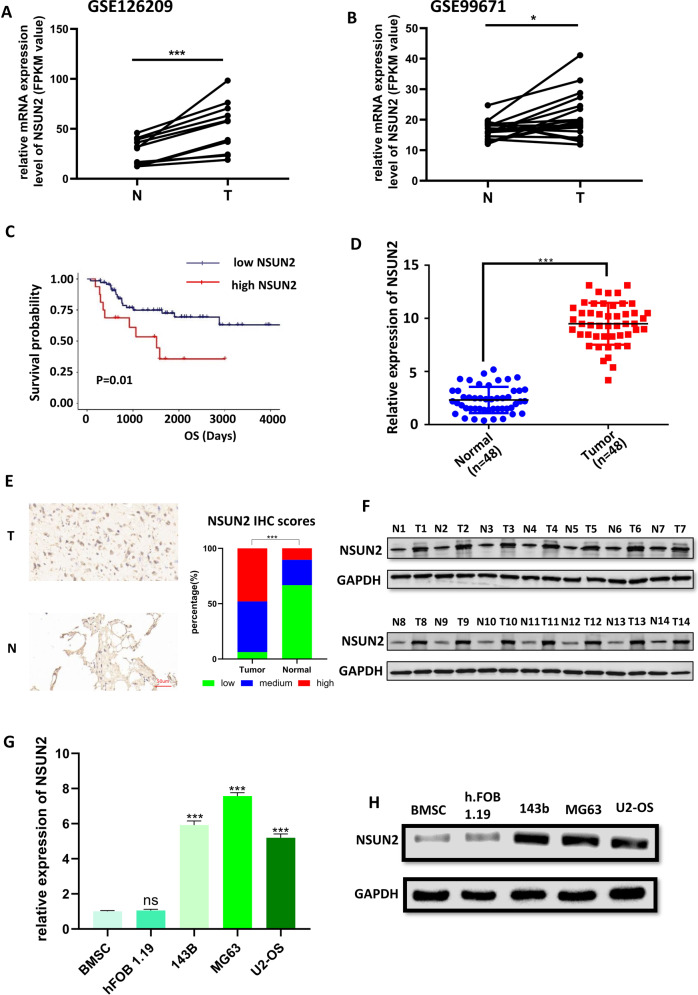
Fig. 1. NSUN2 is highly expressed in OS cells and tissues.
A, B The expression of NSUN2 in OS tissues and normal tissues from GSE126209 (A) and GSE99671 (B). C The survival analysis is made by the data from UCSC-XENA and the software R 3.6.2. The patients were divided into high-NSUN2 and low-NSUN2 by the software R 3.6.2. The results of RT-qPCR (D), IHC (E), and western blot (F) confirmed the expression of NSUN2 was higher in OS tissues. The results of RT-qPCR (G) and western blot (H) showed higher expression of NSUN2 in OS cell lines. The result of RT-qPCR was statistical analyzed according to the data of three independent experiments.

