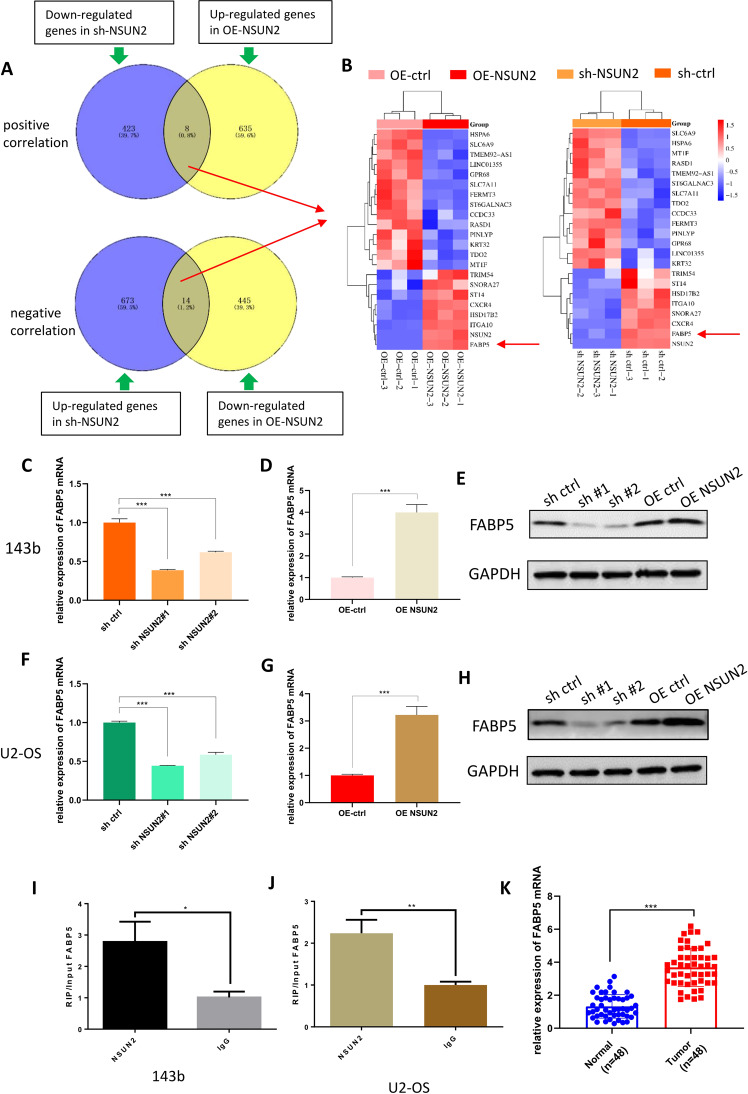
Fig. 4. FABP5 is the potential target of NSUN2.
A Venn diagram of RNA-seq showing the genes whose expression level was positively or negatively correlated with the expression level of NSUN2. The sh-NSUN2 group means the cells were stably transfected with sh-NSUN2#1. B The heatmaps made by the genes obtained from (A). C, D The results of RT-qPCR showed the expression level of FABP5 mRNA when NSUN2 was knocked down or overexpressed in 143b cells. E The results of western blot showed the expression level of FABP5 protein when NSUN2 was knocked down or overexpressed in 143b cells. F, G The results of RT-qPCR showed the expression level of FABP5 mRNA when NSUN2 was knocked down or overexpressed in U2 cells. H The results of western blot showed the expression level of FABP5 protein when NSUN2 was knocked down or overexpressed in U2 cells. I, J The results of RIP and RT-qPCR in 143b and U2 cells. IgG was used as a negative control to preclude nonspecific binding. K The result of RT-qPCR showed FABP5 was highly expressed in OS tissues. The result of RT-qPCR was statistical analyzed according to the data of three independent experiments.

