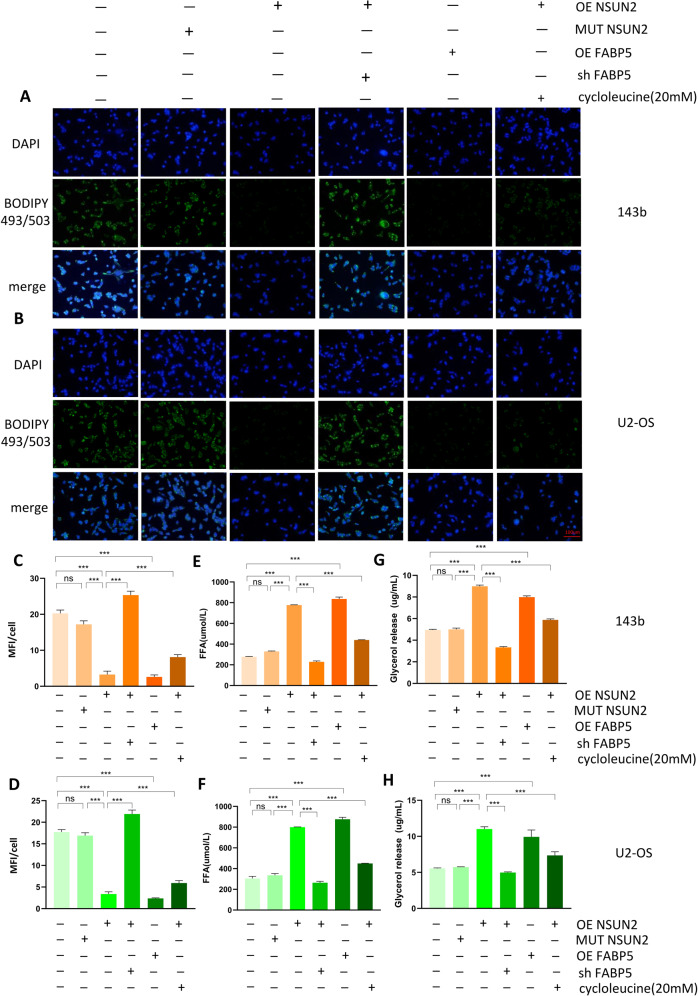
Fig. 6. NSUN2 promotes fatty acid metabolism in OS cells.
A, B The level of neutral lipids in OS cells was detected by BODIPY 493/503. C, D Quantification and statistics of the mean fluorescence intensity (MFI) for stably transfected OS cells. E, F The level of FFAs in stably transfected OS cells. G, H The level of glycerol in stably transfected OS cells. The sh-NSUN2 group means the cells were stably transfected with sh-NSUN2#1. Statistical analysis was performed according to the data of three independent experiments.

