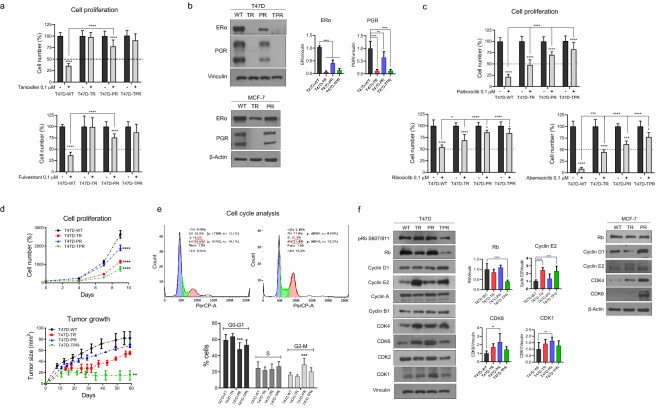
Figure 1.
The resistant cells display alterations in proliferation and cell cycle. (a) Effect of ER inhibitors on cell proliferation. T47D cell variants were treated with 4-hydroxytamoxifen (0.1 µM), fulvestrant (0.1 µM) or vehicle for 7 days and counted at the end of the experiment. ****p < 0.0001. Data represent mean ± SD, two-way ANOVA followed by Tukey's test (independent replicates n = 3, with 4 experimental replicates in each group). (b) Expression of hormone receptors. Protein lysates were obtained under basal conditions and analyzed by immunoblot with the indicated antibodies. For T47D variants, bands were quantified by densitometry and relativized to their loading control. **p < 0.01, ****p < 0.0001. Data represent mean ± SD, one-way ANOVA followed by Dunnett’s test (independent replicates n = 3, with 3 experimental replicates in each group). (c) Effect of CDK4/6 inhibitors on cell proliferation. T47D cells were treated with palbociclib (0.1 µM), ribociclib (0.1 µM), abemaciclib (0.1 µM) or vehicle for 7 days and counted at the end of the treatment. *p < 0.05, ***p < 0.001, ****p < 0.0001. Data represent mean ± SD, two-way ANOVA followed by Tukey's test (independent replicates n = 3, with 4 experimental replicates in each group). (d) Cell proliferation and tumor growth. Top: Cells were cultured in the absence of drugs and quantified every 2 days. ****p < 0.0001. Data represent mean ± SD, two-way ANOVA followed by Dunnett's test (independent replicates n = 3, with 4 experimental replicates in each group). Bottom: Tumor growth curves. 8 × 10⁶ cells of each variant were injected subcutaneously in the lateral flank of NSG mice, previously implanted with silastic pellets containing 17β-estradiol (0.25 mg). **p < 0.01. Data represent mean ± SD, one-way ANOVA followed by Dunnett's test at the end of the experiment (independent replicates n = 2, with 3 experimental replicates in each arm of treatment). Representative curve of two. (e) Cell cycle analyses. T47D cells were stained with propidium iodide and analyzed by flow cytometry. ***p < 0.001. Data represent mean ± SD, one-way ANOVA followed by Dunnett's test (independent replicates n = 4, with 4 experimental replicates in each group). (f) Expression of cell cycle proteins. Protein lysates were obtained under basal conditions and analyzed by immunoblot with the indicated antibodies. For T47D variants, bands were quantified by densitometry and relativized to their loading control. **p < 0.01, ***p < 0.001, ****p < 0.0001. Data represent mean ± SD, one-way ANOVA followed by Dunnett's test (independent replicates n = 2, with 3 experimental replicates in each group). Original blots/gels are presented in Supplementary Material, unprocessed western blots section.

