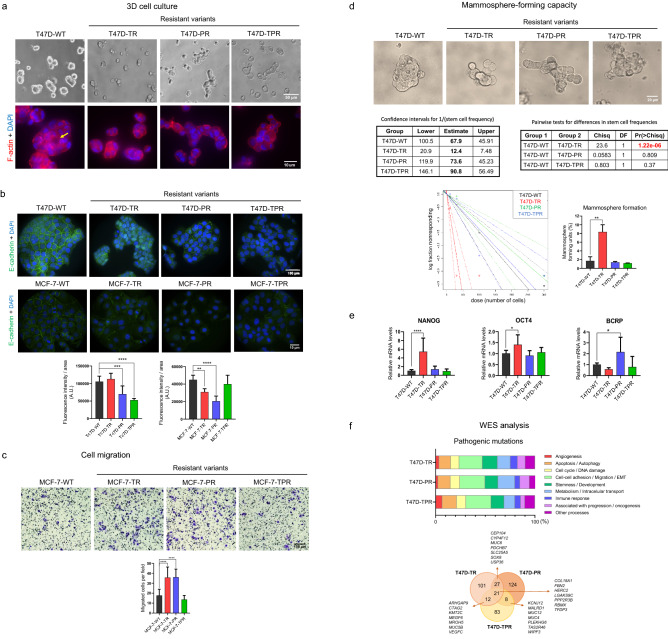
Figure 2.
The resistant cells exhibit an altered phenotype. (a) 3D cultures. T47D cells were cultured on Geltrex for 48 h. 3D cultures were stained for F-actin with phalloidin (red), and nuclei were counterstained with DAPI (blue). Some of the T47D-WT spheroids exhibited a lumen (yellow arrow). (b) Expression and localization of E-cadherin. Confocal microscopy images of immunofluorescence staining for E-cadherin (green). Nuclei were counterstained with DAPI (blue). **p < 0.01, ***p < 0.001. Data represent mean ± SD, one-way ANOVA followed by Dunnett's test (independent replicates n = 2, with 10 analyzed fields in each group). Since resistant cells are bigger than wild type cells, fluorescence intensity was adjusted to cell area. (c) Cell migration. Transwell migration assays were performed by seeding MCF-7 cells onto 8 µm-pore inserts in the presence of a serum gradient. After 24 h, cells that passed through the insert and attached to the other side were quantified. ***p < 0.001. Data represent mean ± SD, one-way ANOVA followed by Dunnett's test (independent replicates n = 3, with 4 experimental replicates in each group). (d) Mammosphere-forming capacity. Mammosphere formation assays and Extreme limiting dilution assay were performed. Sphere formation frequencies were compared using the ELDA web tool (left). The number of cells seeded per well versus the logarithmic fraction of wells without any detected spheres was plotted (middle). Trend lines represent the estimated active cell frequency, dotted lines show the 95% confidence interval. Percentage of sphere-forming units was plotted according to % = 1/Frequency × 100 (right). **p < 0.01. Data represent mean ± SD, one-way ANOVA followed by Dunnett's test (independent replicates n = 2, with 6 experimental replicates in each group). (e) Expression of stemness markers. mRNA levels of NANOG, OCT4 and BCRP were measured by qRT-PCR. Expression levels were normalized to the GAPDH expression for each variant. *p < 0.05, ****p < 0.0001. Data represent mean ± SD, one-way ANOVA followed by Dunnett's test (independent replicates n = 3, with 3 experimental replicates in each group). (f) Pathogenic mutations in T47D-resistant cells. Mutations that were not present in the parental cells were filtered by potential pathogenicity using REVEL, SIFT, Polyphen2 and CLNSIG predictors. Top: Mutated genes were grouped according to their function or the cellular processes they are involved in. Bottom: Venn Diagram showing the number of pathogenic mutations in the resistant cells and some relevant mutated genes. Original images are presented in Supplementary Material, unprocessed photomicrographs section.

