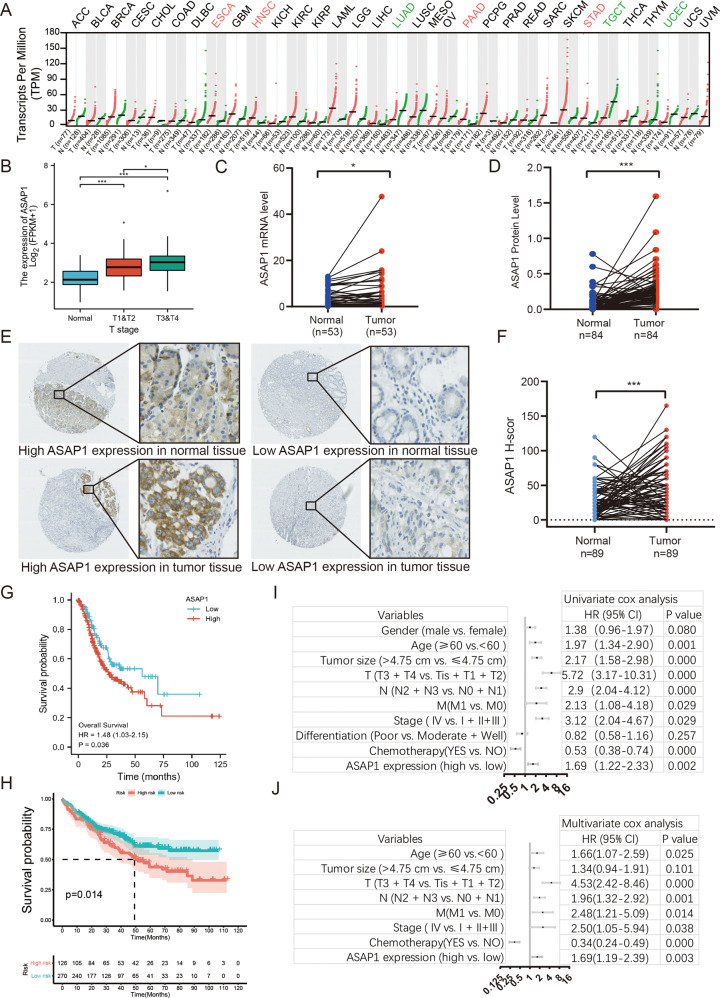
Fig. 2. Clinical significance of ASAP1 expression in GC.
A The histogram shows the ASAP1 expression in 27 kinds of human normal tissues. B The expression of ASAP1 in TCGA STAD in different T stages patients. C The expression levels of ASAP1 in 53 paired gastric tumor tissues and adjacent normal tissues were detected by real-time fluorescence quantitative PCR. D The expression levels of ASAP1 in 84 paired gastric tumor tissues and adjacent normal tissues detected by protein profiling. E Representative IHC images of ASAP1 staining in the GC and normal tissue samples, Bar in 40× and 400×. F Compared ASAP1 scores in 89 paired gastric tumor tissues and adjacent normal tissues. G Kaplan–Meier OS curves of patients with GC according to ASAP1 mRNA expression in TCGA dataset. H Kaplan–Meier OS curves of 551 patients with GC according to ASAP1 scores. I, J Indicated clinicopathologic features were brought into univariable risk factor analysis (I) and features associated with prognosis were further brought into multivariable risk factor analysis using Cox regression model (J). ns not significant; *p < 0.05; **p < 0.01; ***p < 0.001.

