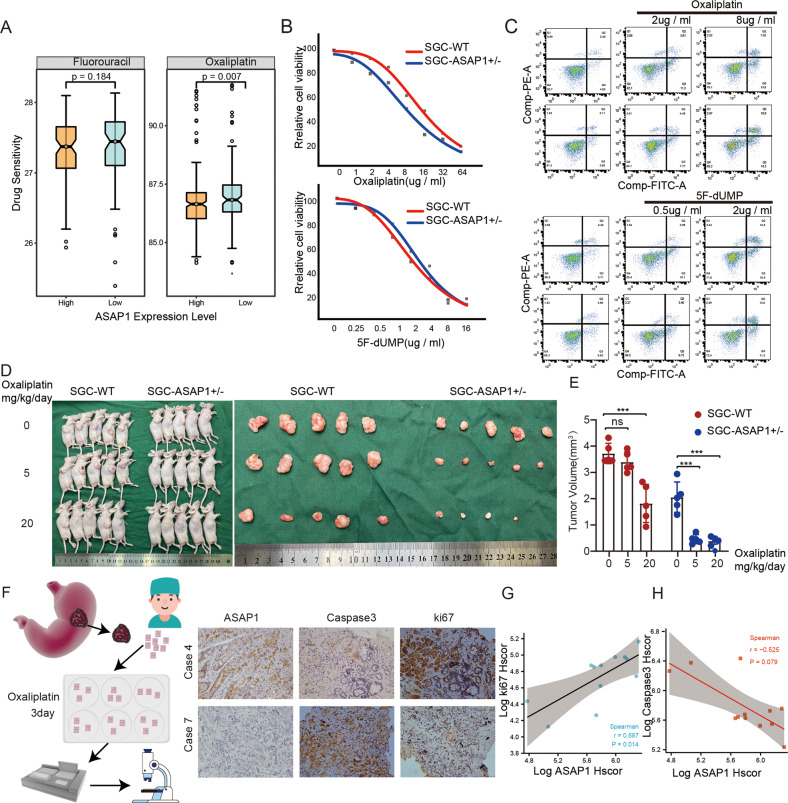
Fig. 7. ASAP1 promotes chemotherapy resistance in GC.
A Drug sensitivity prediction demonstrated that pateints with high expression of ASAP1 tended to be more sensitive to oxaliplatin (p = 0.007), whereas there was no statistical difference in the sensitivity to fluorouracil between patients with high and low expression of ASAP1. B The effect of ASAP1 on the viability of SGC-7901 cells in response to oxaliplatin or 5-FU. The WT and ASAP1+/− SGC-7901 cells were treated with increasing concentrations of oxaliplatin or 5-FU for 48 h. Cell viability was measured by CCK-8. IC50 values in two different drug treatments are shown (n = 3). C Flow cytometry analysis showing the comparison of apoptosis induction between WT and ASAP1+/− SGC-7901 cells in response to oxaliplatin. Bar chart showing the percentage of apoptotic cells with mean values ± standard error of the mean (SEM), n = 3 biologically independent samples. The data are representative of three experiments with similar results. Statistical analysis was performed using two-tailed unpaired t-test. D, E Subcutaneous tumor model was established and injected different concentrations of Oxa intraperitoneally to nude mice, after 30 days, the nude mice were sacrificed to measure tumor size. F–H Comparison the activity of gastric cancer tissue 3D culture treated with oxaliplatin. KI67 staining intensity was used to analyze the correlation between ASAP1 expression and tissue viability after oxaliplatin treatment. Caspase3 staining intensity was used to analyze the correlation between ASAP1 expression and apoptosis after oxaliplatin treatment.

