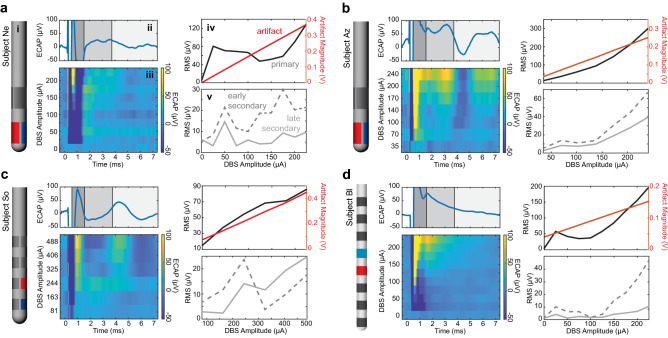
Figure 4.
ECAP responses to increasing stimulation amplitudes across all subject (a–d). (subpanel i) Lead diagrams for each subject with stimulation electrode shown in red and recording site shown in blue. Example ECAP response to (subpanel ii) the highest stimulation amplitude tested in the MPTP-treated state and (subpanel iii) varying stimulation current amplitudes. RMS values across stimulation amplitudes from epochs containing the (subpanel iv) stimulation artifact and primary features and (subpanel part v) secondary features.

