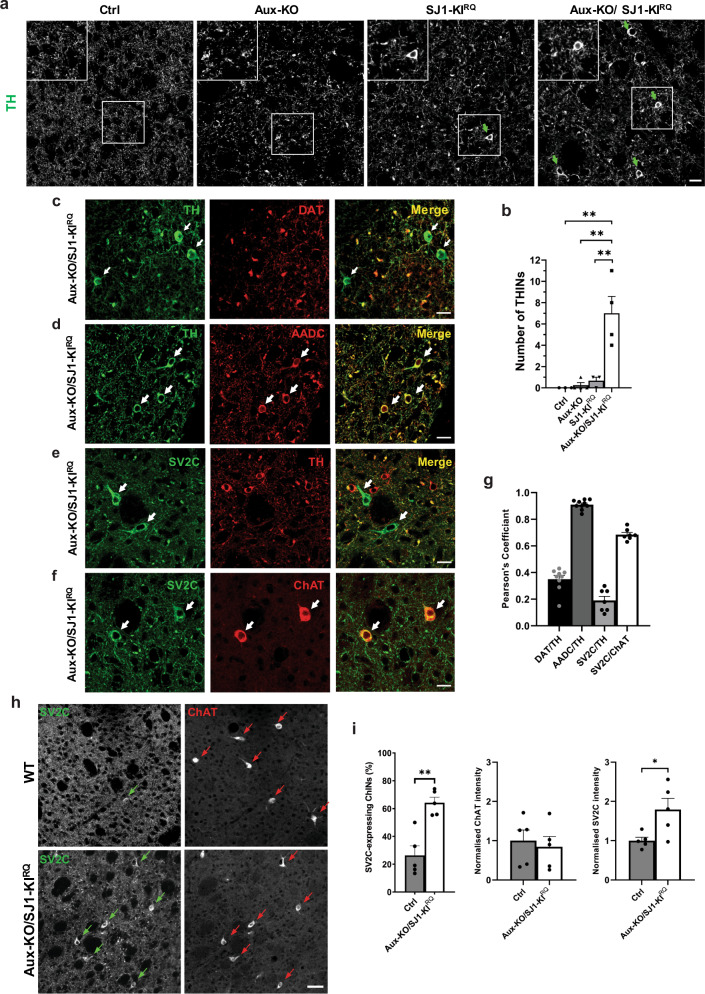
Fig. 7. Adaptive changes of TH-positive interneurons and SV2C-positive cholinergic interneurons in Aux-KO/SJ1-KIRQ striatum.
a Immunostaining of TH reveals the Aux-KO/SJ1-KIRQ striatum contains a large number of THINs. THINs are not found in Ctrl and Aux-KO striatum; and are less often found in SJ1-KIRQ striatum. Scale bar: 20 µm. b Quantification for the number of THINs in 10 randomly selected regions of interest (ROIs) from a representative coronal section of the striatum. Data are represented as mean ± SEM (**p < 0.01 by one-way ANOVA with post-hoc Tukey’s test). n = 3–4 mice for each genotype. c Immunostaining of TH (green) and DAT (red) reveals presence of TH-positive/DAT-negative neurons in the 1-month-old Aux-KO/SJ1-KIRQ striatum. Scale bar: 20 µm. d THINs also show immunoreactivity towards anti-AADC antibody. Scale bar: 20 µm. e Representative images of SV2C and TH staining in the dorsal striatum of 1-month-old Aux-KO/SJ1-KIRQ mice. TH and SV2C were observed to be expressed in separate neuron populations. SV2C-positive/TH-negative neurons are marked by white arrows. Scale bar: 20 µm. f Double staining of striatal region with cholinergic marker ChAT and SV2C shows overlap between the two in a specific neuronal subset, indicating that the SV2C-positive neurons are giant striatal ChINs. Scale bar: 20 µm. g The cell bodies of THINs and ChINs are selected as our region of interest to perform Pearson’s correlation coefficient. This demonstrate the two different types of interneurons: THINs where TH and AADC colocalizes well but not with DAT; ChINs where SV2C colocalizes well with ChAT but not with TH. Data are represented as mean ± SEM. n = 7–10 random sampling site. h Striatal IHC for single coronal section reveals subset of ChAT-positive ChINs that exhibit striking upregulation of SV2C in Aux-KO/SJ1-KIRQ mice compared to control. Scale bar: 50 µm. i Quantification for percentage of ChAT-positive interneurons expressing SV2C, as well as individual intensity of SV2C and ChAT in striatal ChINs. For each individual mouse, 20 ChINs across a single coronal section of striatum were randomly selected for quantification. Data are represented as mean ± SEM (*p < 0.05 and **p < 0.01, by Student’s unpaired t test). Ctrl: n = 5 mice and Aux-KO/SJ1-KIRQ: n = 5 mice.

