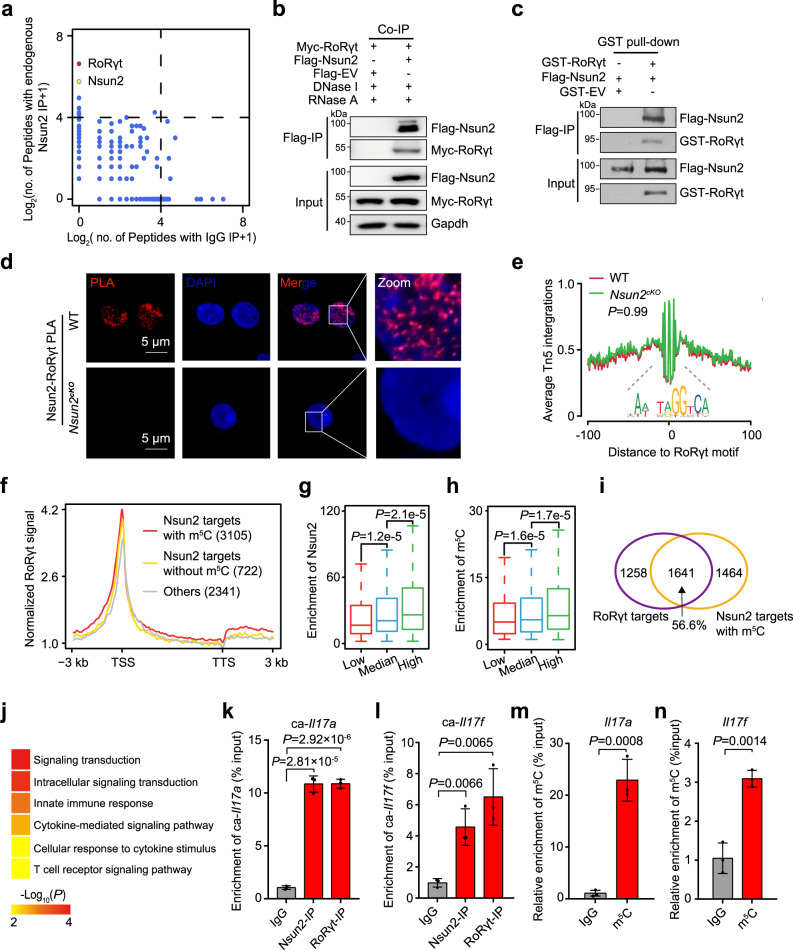
Fig. 2. Nsun2 couples with RoRγt to promote m5C formation on Th17-related genes.
a IP-MS analysis showing the interacting partners of Nsun2 in induced Th17cells. b Co-immunoprecipitation showing the interaction of Nsun2 and RoRγt. c GST pull-down assay showing the interaction between Nsun2 and RoRγt. d PLA analysis for Nsun2 and RoRγt in induced Th17 cells. Scale bars, 5 μm. DAPI, nuclei. e The footprint profiles of RoRγt in Th17 cells with (Red) or without (Green) Nsun2 depletion. P value was determined by two-tailed Student’s t-test. f The metaplots of normalized RoRγt signal along gene bodies from Transcription Start Site (TSS) to Transcription Termination Site (TTS), plus or minus 3 kb. Genes had been divided into three groups including Nsun2 targets with (Red) or without (Gold) m5C and others (Gray). g, h Distribution of Nsun2 (g) or m5C (h) enrichment relative to RoRγt binding efficiency. The Nsun2 targets with m5C were divided into three equal groups according the normalized signal of RoRγt ChIP-seq at their TSSs (±3 kb), each group with 1035 genes. Using the associated IP and input samples, the overall Nsun2 or m5C enrichment distributed in each gene was respectively evaluated by MACS2. P value was determined by two-way Mann-Whitney U test and only value between Q1-1.5*IQR and Q3 + 1.5*IQR has been shown in boxplot. i Venn diagram showing the overlap between RoRγt targets and Nsun2 targets with m5C. j Heatmap displaying gene ontology biological processes enriched in the genes with m5C which were also bound by Nsun2 and RoRγt. P value was determined by right-sided Fisher test. k, l RT-qPCR showing the binding efficiency of Nsun2 and RoRγt on chromatin-associated Il17a (k) and Il17f (l) RNAs in induced Th17cells (n = 3 per group). m, n, m5C MeRIP-qPCR analysis showing the m5C enrichment in Il17a (m) and Il17f (n) mRNAs (n = 3 per group). IgG served as negative control. All data are representative of at least two independent experiments. Data are analyzed using two-tailed unpaired Student’s t-test. Error bars represent mean ± s.e.m. k–n Source data are provided as a Source Data file.

