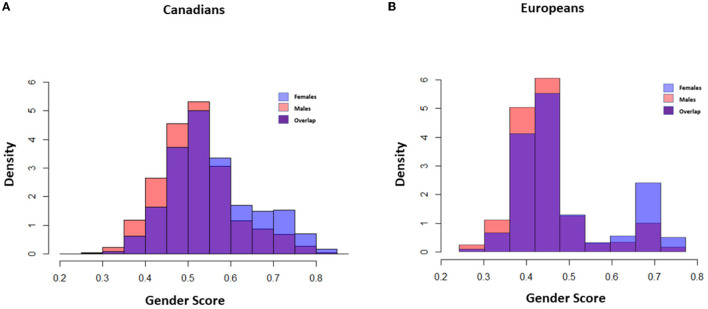
Figure 2.
Gender score distribution in Canadians and Europeans. Density Plot: Y Axis: probability density of gender, X Axis: gender score I: Gender score distribution in male and females in Canadian (A) and European populations (B). Red, Gender score in males; Blue, Gender score in females; Purple, Overlapping of Gender score in both groups. Higher gender score demonstrates characteristics traditionally ascribed to women in the population. The distribution of the gender score in men and women did not entirely overlap with biological sex in both populations which shows their partially independent effect. Moreover, the distribution was more polarized in Europeans and there was less overlap between roles in the society.

