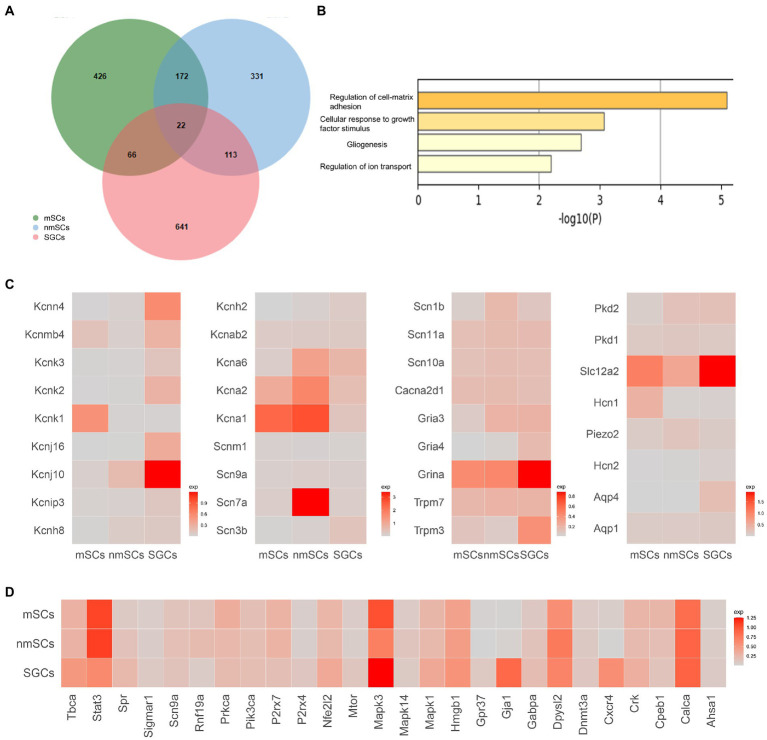
Figure 4.
Comparison of gene expression in three types of glial cells in TG. (A) Venn diagram of the highly expressed genes of SGCs, mSCs, nmSCs. The colors denote the cell types. Number of cells for the glial cell clusters: mSCs (5647), nmSCs (1944), SGCs (3356). (B) Functional enrichment analysis of shared expression genes of SGCs, mSCs, nmSCs. The row represents-log 10Pvalues, the column represents terms for functional enrichment. (C) Gene heat map of sodium, potassium, calcium channels, and other channels and receptors expressed in SGCs, mSCs, and nmSCs. Color intensity indicates levels of gene expression. (D) Gene heat map of pain-related gene sets expressed in SGCs, nmSCs, mSCs.

