Figure 5.
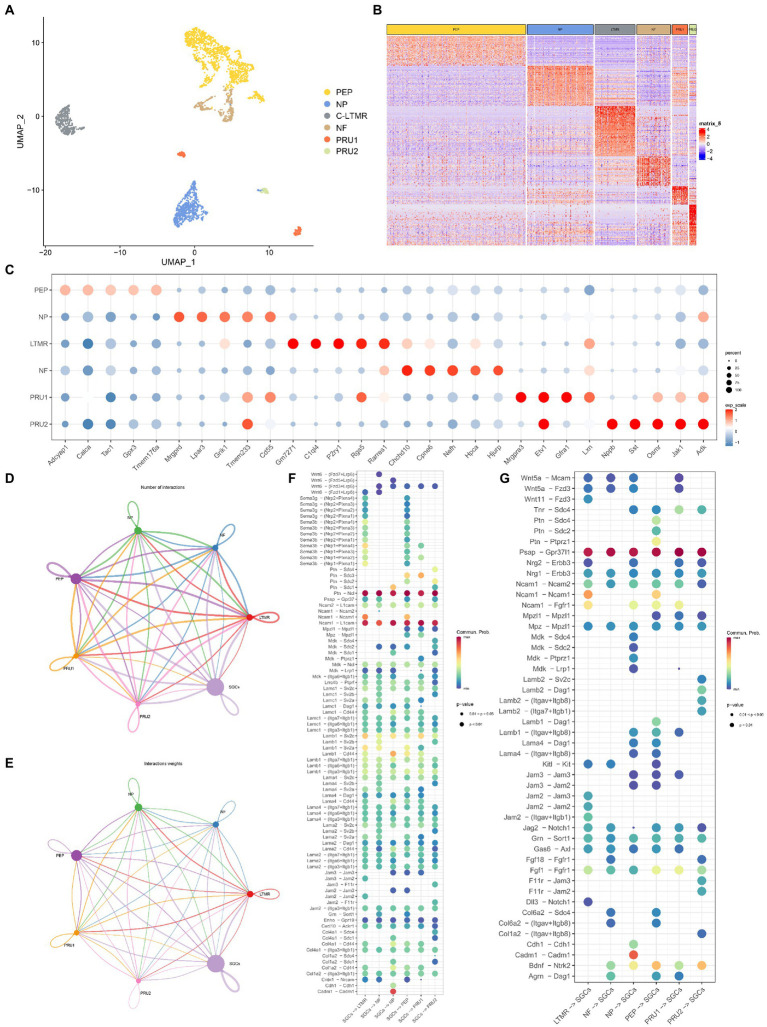
Cell-cell communication analysis between neurons and SGCs in TG. (A) The UMAP plot of six neuron subtypes in TG. Number of cells for the neuron subtypes: PEP (1365), NP (649), cLTMR (397), NF (332), PRU1 (155), PRU2 (69). (B) The gene heat map of neuron subtypes in TG. (C) The dot plot of the top 5 maker genes for neuron subtypes in TG. (D) Network of interaction numbers between neurons and SGCs constructed by CellChat. (E) Network of interaction weight between neurons and SGCs. The color of the line is consistent with the cell of ligand origin, and the thickness of the line indicates the interaction strength or the number of interactions. (F,G) The dot plot of interaction scores as the ligand expressing cell-the receptor expressing cell (horizontal axis). Specific ligand-receptor pairs are listed along the vertical axis. The color of the dots indicates the calculated interaction probability, with dark red dots indicating stronger predicted interactions. The ligand-receptor pairs in neurons-SGCs (F), the ligand-receptor pairs in SGCs-neurons (G).

