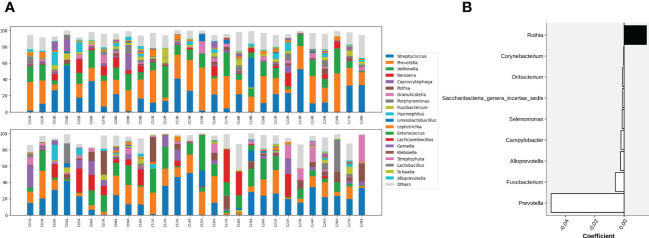
Figure 3.
(A) Compositions of top 20 abundant genera in oral samples of group C before (top) and after (bottom) gargling. Rest genera are combined in the “Others” category. The space between 100% and height of each stacked bar shows the fraction of unclassified bacteria. (B) Differentially abundant genera; the +/- sign of a coefficient indicates an increase/decrease in the fraction after gargling and the value indicates the magnitude of change.

