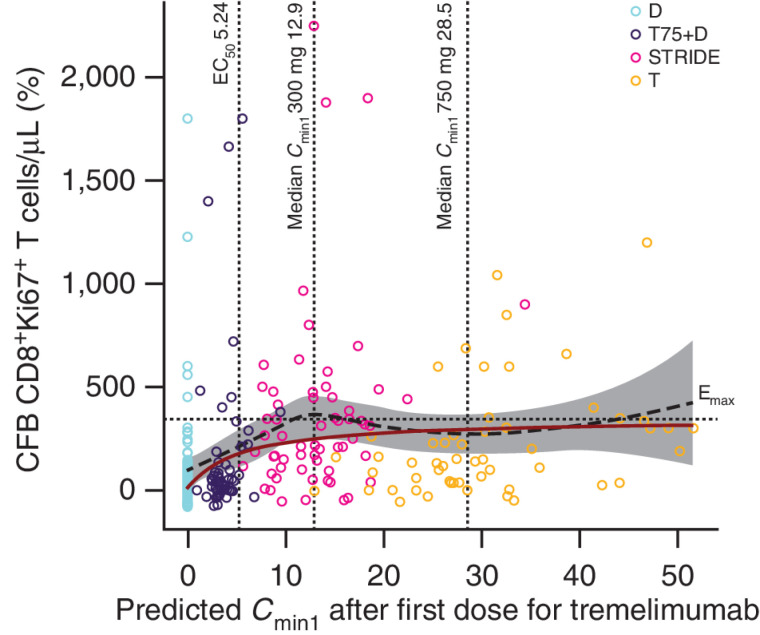
Figure 6.
CFB on day 15 of proliferating CD8+Ki67+ T cells versus predicted tremelimumab exposure (PD analysis population); N = 165. The black dashed line and gray-shaded area represent a loess smooth curve and 95% CI for the observed data. The dark red line is the model-predicted response (%CFB) at median CD8+Ki67+ T-cell count. The horizontal dotted line indicates the estimated Emax. The vertical lines indicate the predicted EC50 and the median Cmin1 after first dose (day 28) for 300 and 750 mg tremelimumab. T-cell response to durvalumab is included in the graph as a baseline measurement. Durvalumab monotherapy was included in this analysis as a control. CFB, change from baseline; Cmin1, minimum tremelimumab concentration at day 28; D, durvalumab monotherapy (durvalumab 1,500 mg once every 4 weeks); Emax, maximal effect of tremelimumab on CD8+Ki67+ T-cell counts; EC50, concentration of tremelimumab eliciting half-maximal increases in CD8+Ki67+ T-cell counts; N, number of patients included in the analysis; PD, pharmacodynamics; STRIDE, Single Tremelimumab Regular Interval Durvalumab (single dose of tremelimumab 300 mg with durvalumab 1,500 mg, followed by durvalumab 1,500 mg once every 4 weeks); T, tremelimumab monotherapy (tremelimumab 750 mg once every 4 weeks for a total of seven doses then once every 12 weeks); T75+D, tremelimumab 75 mg plus durvalumab 1,500 mg once every 4 weeks for a total of four doses, followed by durvalumab monotherapy once every 4 weeks; T300+D.

