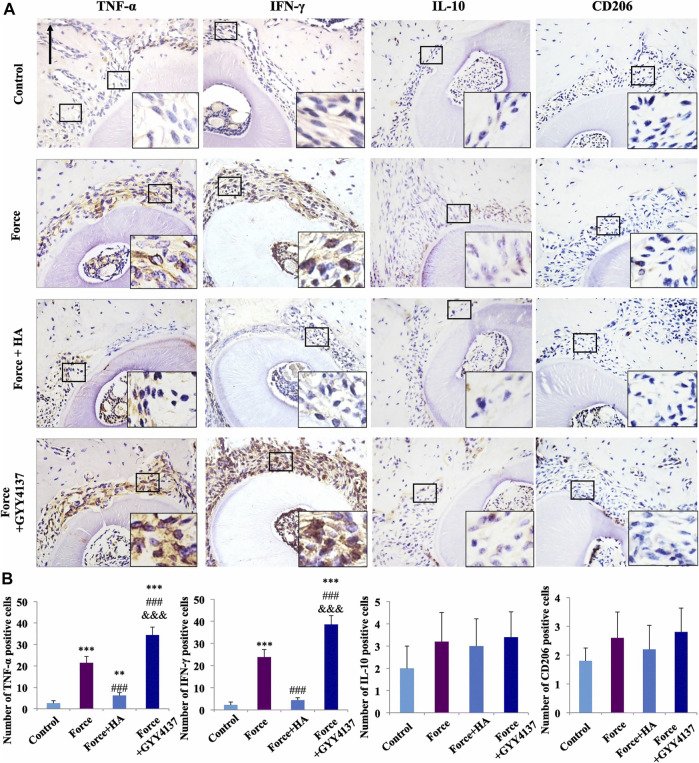
FIGURE 4.
Immunohistochemical staining image of M1/M2 macrophage markers (A). Semiquantification analysis of M1/M2 macrophage (B). Scale bars: 100 μm **p < 0.01, ***p < 0.001 comapered with control. ### p < 0.001 comapered with force. and &&& p < 0.001 comapered with force + HA. Reproduced with permission from (He et al., 2020).

