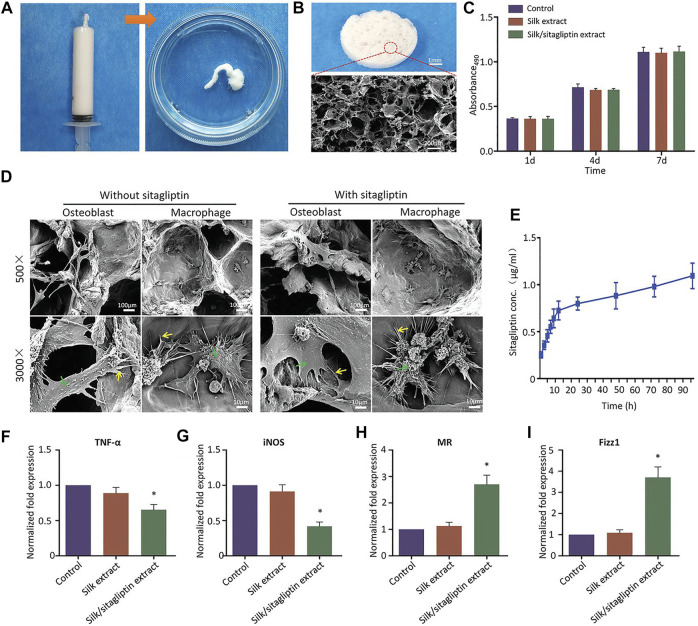
FIGURE 5.
Injectable characterization of the scaffold system (A). Microstructure of the scaffold under SEM (B). The proliferation of mouse cells at day 1, 7, and 14 (C). The attachment of macrophages or osteoblasts to scaffolds under SEM (D). Drug release curve in the scaffold system (E). The expression of M1-related biomarkers after 24 h (F, G). The expression of M2-related markers after 24 h (H, I). *p < 0.05 comapered with control group. Reproduced with permission from (Xiang et al., 2021).

