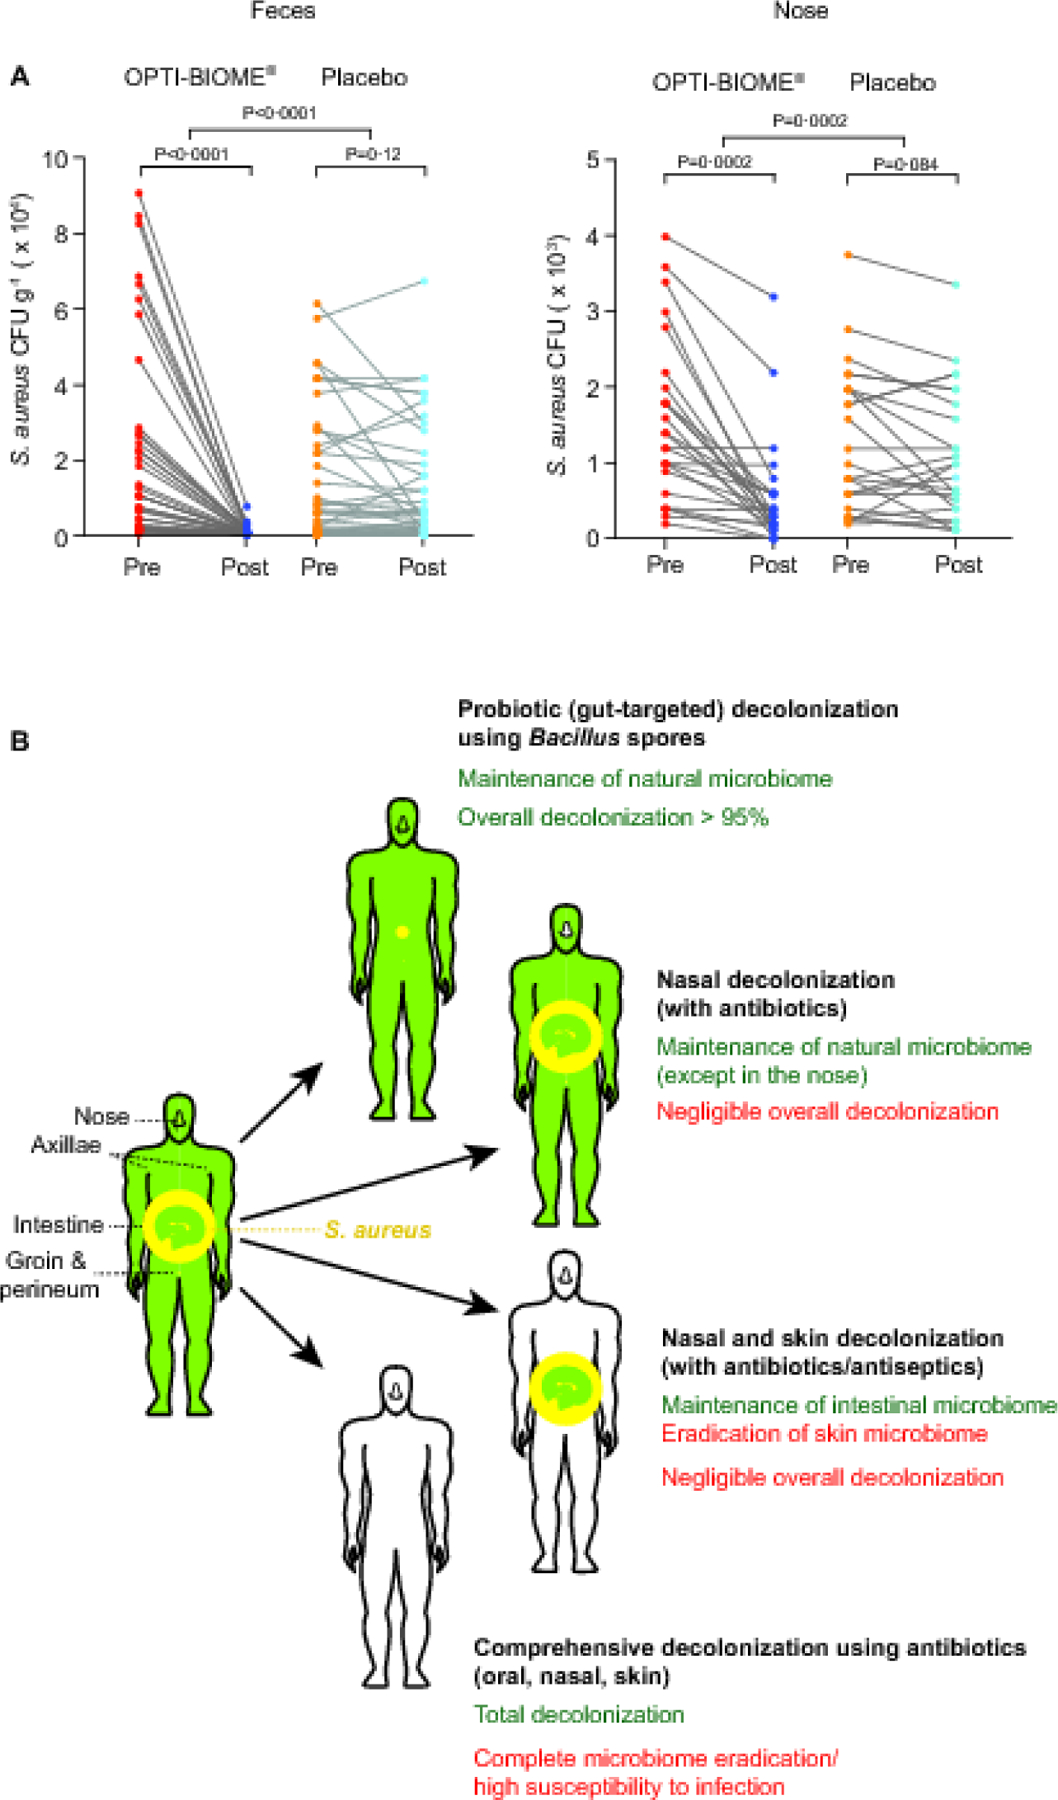
Figure 2. Trial results with colonization levels by individual and study interpretation.

A, Pairwise comparison of pre- and post-intervention colonization levels for specific individuals and statistical analysis of the effect difference between treatment and placebo by comparing differences between pre-and post-levels by Mann-Whitney tests. Statistical analysis of difference between pre- and post-intervention data within a group is by Wilcoxon matched-pairs signed-rank test. All error bars show the mean ± SD. B, S. aureus distribution in the human body and comparison of decolonization strategies. The average abundance of S. aureus in S. aureus-colonized individuals in the intestine, nares, and predominant further skin colonization sites (axillae and groin/perineum) was estimated based on data obtained in this and previous studies. Decolonization efficacies were estimated based on data obtained in this study for probiotic-based decolonization and assuming 100% decolonization for antibiotic/antiseptic-based topical or antibiotic-based comprehensive/systemic (oral application combined with nasal and skin decolonization) methods at the targeted sites. The impact of probiotic treatment on S. aureus in the groin, perineum, and axillae was estimated at a relative decrease as measured for the nares. Yellow, S. aureus. Circle areas represent abundance. For extra-intestinal sites, note comparatively low S. aureus colonization as expressed by small yellow circles. Green, intact microbiome.
