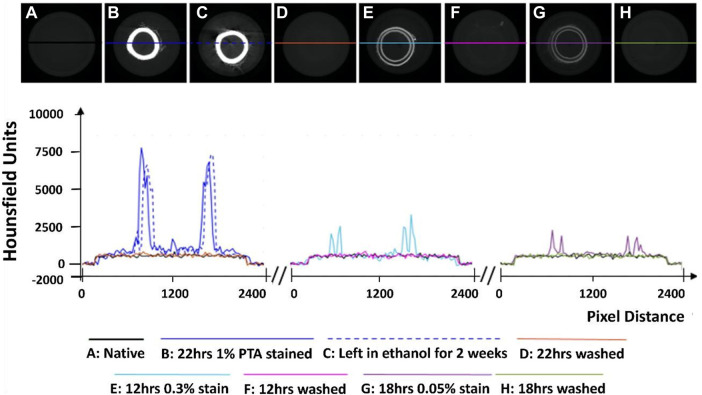
FIGURE 1.
Establishment of the optimum concentration for PTA penetration through arterial tissue samples. (A) Native control (B) Stained sample for 22 h at 1% PTA (C) Preservation in ethanol for 2 weeks (D) Removal of stain using NaOH for 22 h (E) Stained sample for 12 h at 0.3% PTA (F) Removal of stain using NaOH for 12 h. (G) Stained sample for 18hrs in 0.05% stain. (H) Removal of stain using NaOH for 18 h.

