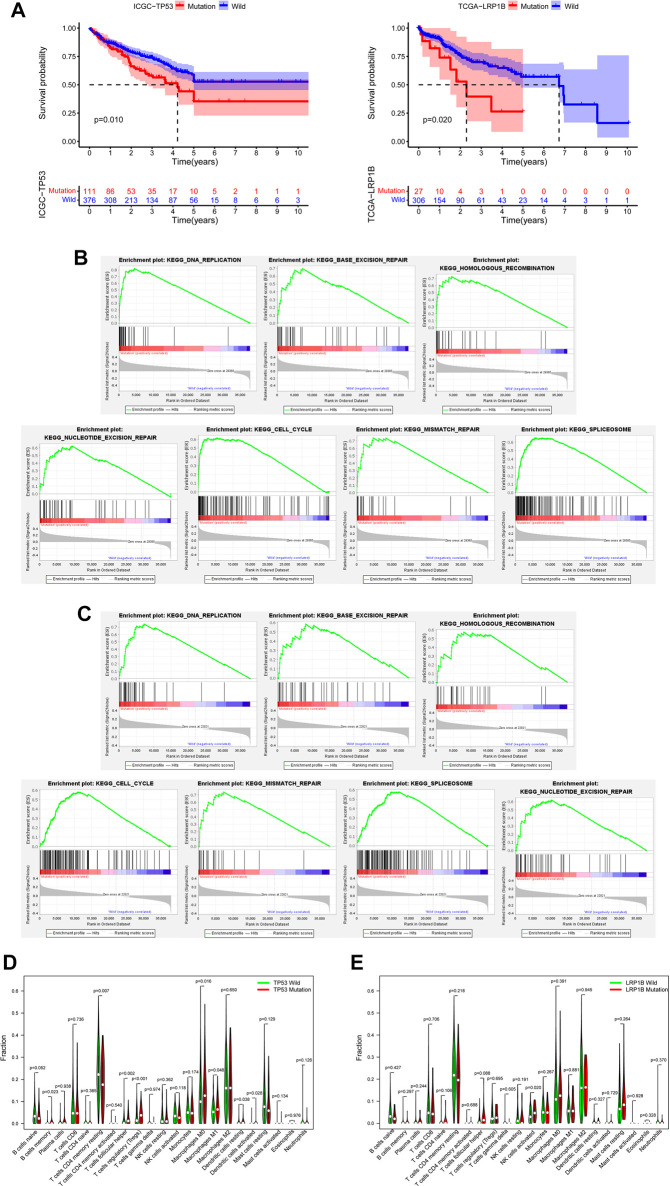
FIGURE 3.
Verification of the database and biological characteristics related to TP53 mutation and LRP1B mutation. (A) Kaplan-Meier survival analysis was performed on the mutation data with clinical information in TCGA and ICGC databases. (B) GSEA enrichment analysis showed that the pathway was significantly related to TP53 mutation. (C) GSEA enrichment analysis showed that the pathway was significantly related to LRP1B mutation. (D) The difference of immunocyte infiltration abundance between TP53 mutation group and wild group in HCC patients. (E) The difference of immunocyte infiltration abundance between LRP1B mutation group and wild group in HCC patients.

