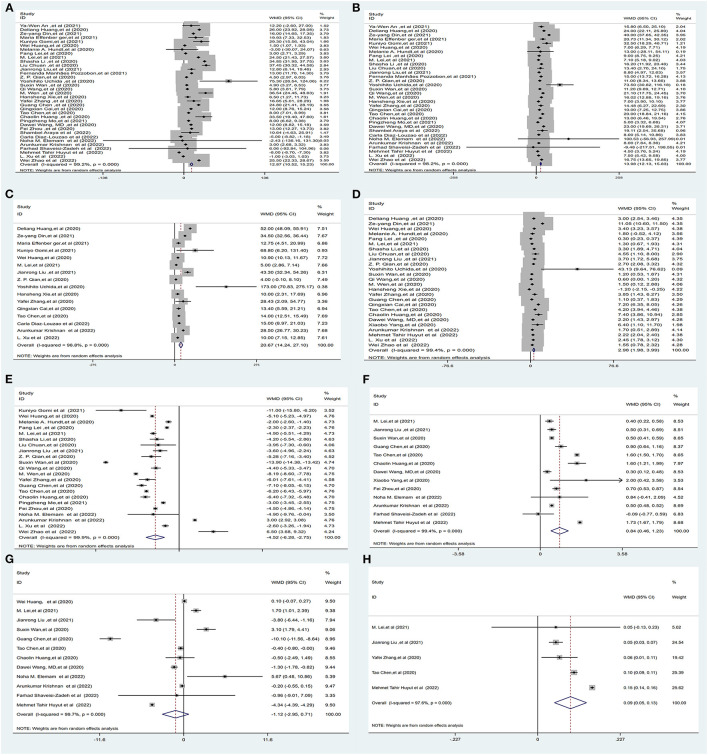
Figure 3.
Forest plot showing the mean serum weight levels of liver chemistries between severe and non-severe patients with COVID-19. (A) Serum ALT levels. (B) Serum AST levels. (C) Serum GGT levels. (D) Serum TBIL levels. (E) Serum ALB levels. (F) Serum PT levels. (G) Serum APTT levels. (H) INR. ALB, albumin; PT, prothrombin time; APTT, activated partial thromboplastin time; INR, international normalized ratio.

